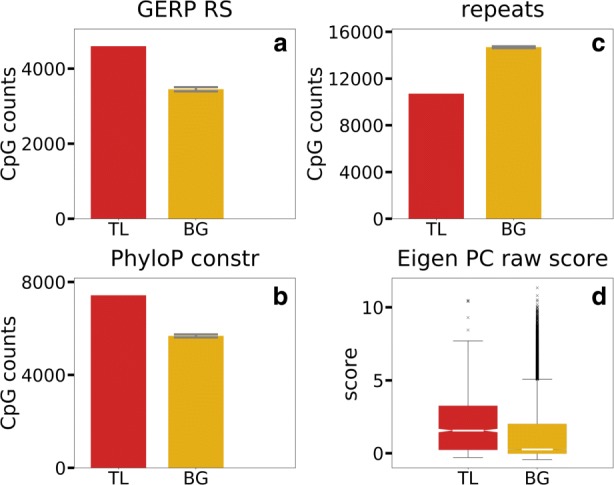
Fig. 2.

Evolutionary conservation of the CpG TL compared to the background CpG sites (BG). a Conservation in mammals and b in primates, c repeats determined by RepeatMasker, d Eigen non-coding functionality score. Whiskers (abc) represent standard deviation out of the 50 random background samples. Fisher exact test, p-value <5E−4 (a - c), Kolmogorov-Smirnov statistic for 2 samples p-value <5E−4 (d)
