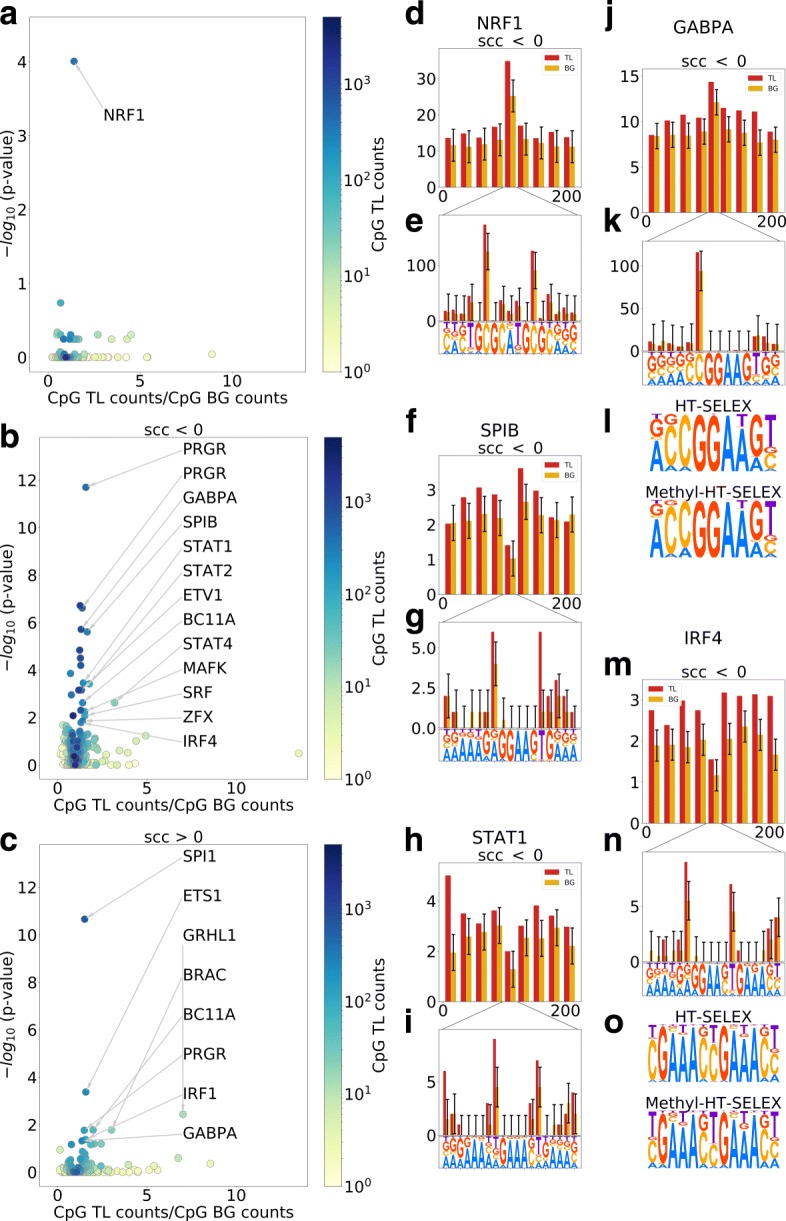
Fig. 5.

CpG TL within transcription factor binding sites. CpG TL to CpG BG ratio vs Fisher’s exact test p-value within a all predicted TFBS; b TFBS and 50 nt shores for CpG TL with a negative SCC and c the same for CpG TL with a positive SCC. Length-normalized distribution of CpG TL / CpG BG counts (negative SCC) within TFBS and 100 nt shores: d NRF1; f SPIB; h STAT1; j GABPA; m IRF4. Per position distribution of CpG TL / CpG BG counts (negative SCC) within TFBS with logo: e NRF1; g SPIB; i STAT1; k GABPA; n IRF4. In vitro binding preferences of unmethylated and methylated oligos: l GABPA; o IRF4
