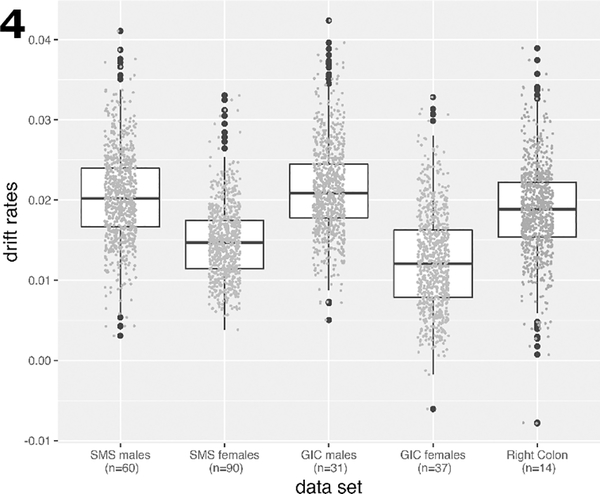
Fig. 4.

Boxplots of the drift rate distributions for the same CGI as in Fig.(2), but validated in samples from the GICR study for left (distal) and right (proximal) colon samples. For each group the individual drift rate estimates are shown as data points. Due to small sample sizes for males and females in right colon, drift rates were determined for both sexes combined in right colon.
