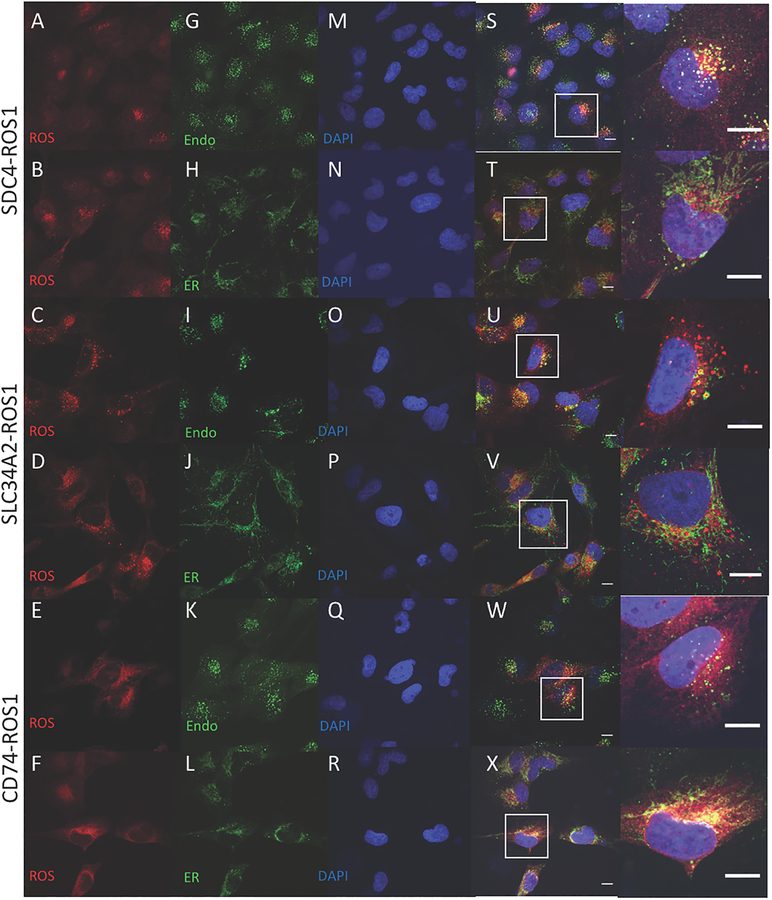
Figure 3. Localization of ROS1 protein in isogenic BEAS-2B system reveals different subcellular localization of the ROS1 fusion oncoproteins.
Immunofluorescence and confocal microscopy in BEAS-2B cells stably expressing SDC4-ROS1, SLC34A2-ROS1, and CD74-ROS1. Rows 1,2 = SDC4-ROS1; Rows 3,4 = SLC34A2-ROS1; Rows 5,6 = CD74-ROS1. Antibodies used were specific for: (A-F) = ROS1; (G,I,K) = EEA1; (H,J,L) = Calnexin; and (M-R) = DAPI; (S-X) = overlay image of the left 3 columns, with (right-most column) adjacent high magnification image of representative cells (outlined by white boxes). Scale bars shown indicate 10μM. Images are representative of ≥ 10 fields and at least 2 biological replicate experiments.

