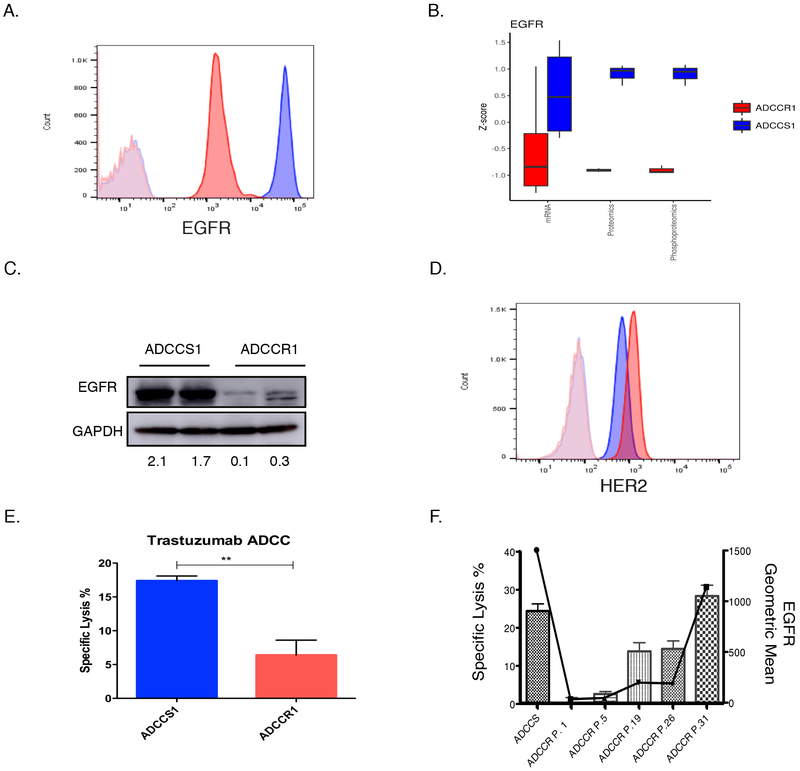
Figure 2: EGFR and HER2 expression in ADCCS1 and ADCCR1 cells.
A, A representative flow cytometry analysis of EGFR cell surface expression in ADCCS1 (blue) cells and ADCCR1 (red) cells with isotype control expression for ADCCS1 (light blue) and ADCCR1 (light red). B, EGFR expression in ADCCS1 and ADCCR1 cells measured by mRNA, proteomic, and phosphoproteomic analysis. Measures of mRNA expression as well as proteomic and phosphoproteomic peptide counts were normalized by mean-centered scaling across sample groups (Z-score) to provide comparable distributions between assay types. Analysis were done on ADCCS1 and ADCCR1 cells post 33 challenges passaged for 3-4 times. C, Western blot for EGFR protein expression in ADCCS1 and ADCCR1 cells. ADCCS1 and ADCCR1 cells post 33 challenges passaged for 3-4 times were used. Densitometry values of expression relative to GAPDH indicated below the blot. D, Representative flow cytometry analysis of HER2 cell surface expression in ADCCS1 (blue) and ADCCR1 (red) cells with isotype control expression for ADCCS1 (light blue) and ADCCR1 (light red). E, Specific lysis of ADCCR1(target) and ADCCS1(target) cells by NK92-CD16V(effectors) cells at a 1:1 E:T ratio in the presence of trastuzumab (5 µg/mL) for 4 hours. **, p < 0.01 by two-tailed t-test. F, ADCC-induced specific lysis percentage (bars) and corresponding EGFR expression geometric mean by flow cytometry (solid line) in ADCCS1 cells and in ADCCR1 cells as a function of serial in vitro passaging (P. denotes passage number) following the cessation of ADCC exposure.

