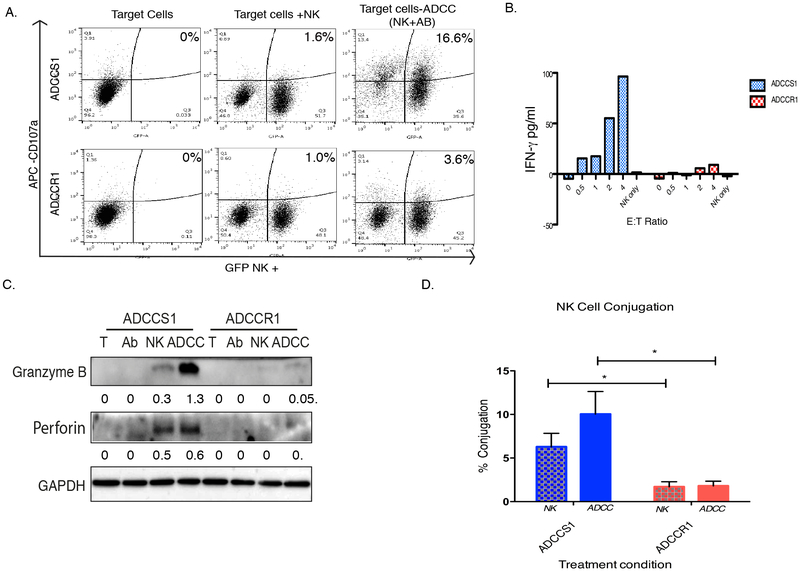
Figure 5: NK cell activation and conjugation to EGFR+ target cells under ADCC conditions.
A, Representative dot plots of NK activation measured by flow cytometry analysis using CD107α (APC) and GFP+ NK92-CD16V cells at a 1:1 E:T for 2 hours as described in Materials and Methods. ADCCS1 (top row) and ADCCR1 cells (bottom row) were incubated with NK92-CD16V cells in the absence (middle panels) or in the presence of cetuximab (1 µg/mL; right panel) for 2 hours. B, ELISA measuring IFNγ levels in the media of ADCCS1 (blue bars) and ADCCR1 (red bars) 4 hours post exposure to ADCC conditions (cetuximab [1 µg/mL] plus NK92-CD16V cells) at E:T ratios of 0-4:1 and NK92-CD16V cells in the absence of cetuximab. C, Western blot analysis of granzyme B and perforin protein expression in target cells two hours after exposure to T (media control), Ab (cetuximab only at 1µg/mL), NK (NK92-CD16V cells only at 1:1 E:T) and ADCC (NK92-CD16V cells at 1:1 E:T plus 1 µg/mL cetuximab). D, Percentage of NK cells conjugated to target was measured by a multi-well conjugation assay as described in Materials and Methods. ADCCS1 (blue) and ADCCR1 (red) were incubated with NK92-CD16V cells at a 1:1 E:T ratio in the absence (NK, checkered bar) or in the presence of cetuximab (1 µg/mL; ADCC, solid bar) for 2 hours. *, p < 0.05 by two tailed t test.

