
Figure 1: HuR is required for cell proliferation and invasion in IDH1 mutated cancer cells.
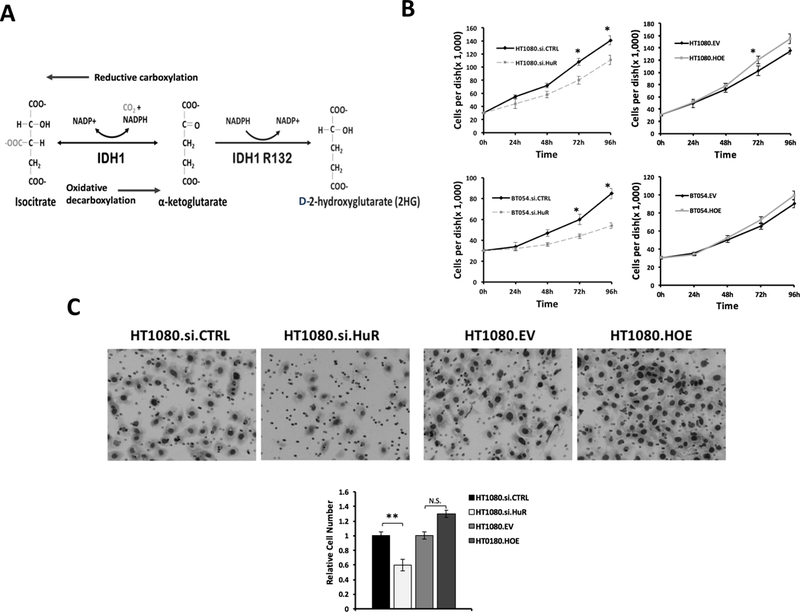
A, Schematic of the WT.IDH1 and Mut.IDH1 catalytic reaction. B, Cell growth (PicoGreen, dsDNA content) of HT1080 and BT054 after HuR knockdown (si.HuR) or overexpression (HOE) compared with control (si.CTRL or EV) for indicated time points. Each data point represents the mean of 5 independent experiments ± standard error of the mean (SEM). *, p < 0.05. C, Representative images of Matrigel invasion assays performed in HT1080 cells after HuR silencing (si.HuR) or overexpression (HOE). Cells that invaded through the Matrigel and onto the basal surface of transwell inserts were stained and photographed at 20X magnification. Quantification of cell number is represented by the bar graph. Data are presented as mean -fold change in invaded cells relative to si.CTRL or EV. Each bar represents the mean of 3 independent experiments ± SEM. N.S. non-significant; **, p < 0.005.