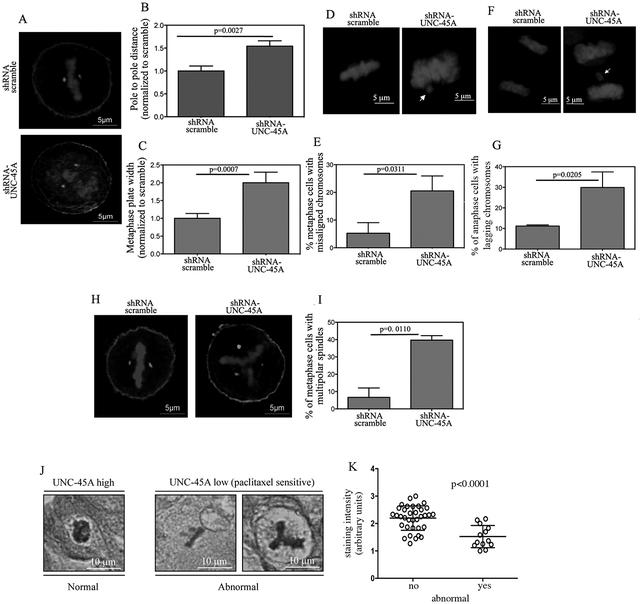
Figure 4. Depletion of UNC-45A causes mitotic defects consistent with overly stable mitotic spindles.
A. Representative images of HeLa cells transduced with either scramble or UNC-45A shRNAs and stained for γ-tubulin or DNA. B. Pole to pole distance quantified following γ-tubulin staining in scramble (n=11) and UNC-45A (n=12) shRNAs transduced HeLa cells. C. Metaphase plate width quantified following DNA staining in scramble (n=11) and UNC-45A (n=12) shRNA transduced HeLa cells. D. Representative images of misaligned (arrow) chromosomes in HeLa cells transduced with either scramble or UNC-45A shRNAs and stained for DNA. E. Quantification of misaligned chromosomes per each condition (scramble n=77, UNC-45A knockdown n=80). F. Representative images of lagging (arrow) chromosomes in HeLa cells transduced with either scramble or UNC-45A shRNA and stained for DNA. G. Quantification of lagging chromosomes per each condition (scramble n=100, UNC-45A knockdown n=83). H. Representative images of multipolar spindles in HeLa cells transduced with either scramble or UNC-45A shRNA and stained for γ-tubulin or DNA. I. Quantification of percentage of cells with multipolar spindles per each condition. J. Representative images of normal (left) versus abnormal (right) mitotic figures in clinical specimens stained by immunohistochemistry for UNC-45A. K. Quantification of UNC-45A staining intensity correlated to the absence (no, n=35) or the presence (yes, n=13) of mitotic abnormalities.

