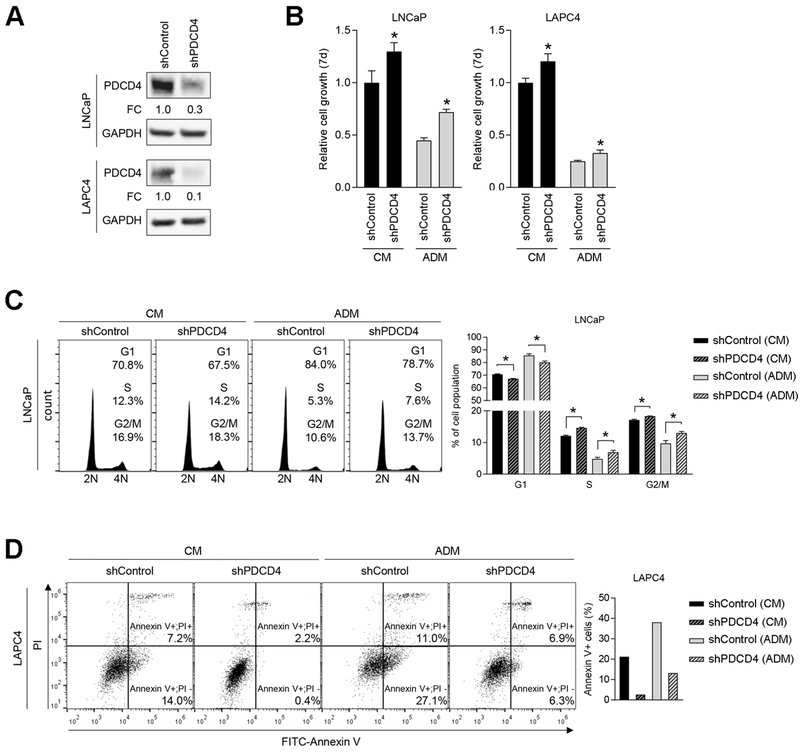
Figure 5. PDCD4 knockdown induces cell cycle progression and inhibits apoptosis in a cell specific manner.
A, Stable PDCD4 knockdown lines. LNCaP or LAPC4-shControl and -shPDCD4 cells were generated by lentiviral transduction. PDCD4 protein expression measured by WB, normalized to GAPDH. FC, Fold Change relative to shControl. B, LNCaP (left panel) or LAPC4 (right panel) cell growth in CM and ADM as measured by MTS assay (7 days). Mean + S.E. from twelve independent measurements. *, p < 0.05, relative to shControl. C, Cell cycle analysis in CM or ADM by flow cytometry, 72 h. Left figure represents one of three independent replicates and right graph shows combined three biologic replicates. Mean + S.E. (n = 3). *, p < 0.05. D, Apoptotic analysis by Annexin V staining and flow cytometry after 72 h growth in CM or ADM. Left figure represents one of three independent replicates and right graph indicates total percentage of Annexin V+ cell population.

