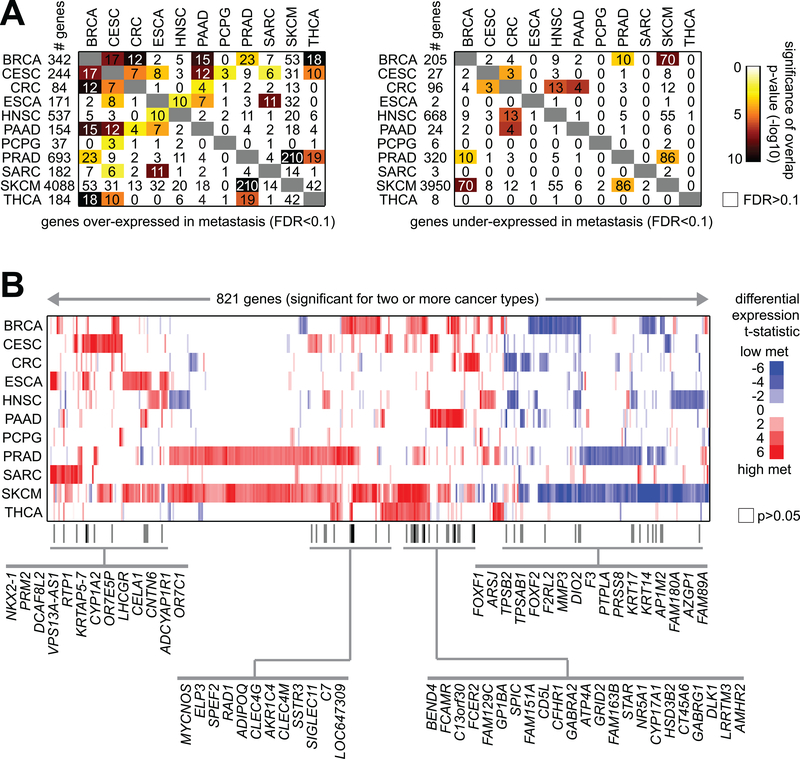
Figure 2. Genes shared among the cancer type-specific metastasis mRNA signatures.
(A) For both the genes over-expressed in metastasis for at least one cancer type (left, genes from Figure 1) and the genes under-expressed in metastasis for at least one cancer type (right, genes from Figure 1), the numbers of overlapping genes between any two cancer types are indicated, along with the significance of overlap (using colorgram, by one-sided Fisher’s exact test). (B) Heat map of differential t-statistics (Pearson’s correlation on log-transformed data), by cancer type, comparing metastasis versus primary (red, higher in metastasis; white, not significant with p>0.05), for 821 genes significant for two or more cancer types (FDR<10%; for SKCM, FDR<10% and significant with p<0.05 for linear model incorporating tumor purity as a covariate). Genes significant for three or more cancer types are indicated by name.

