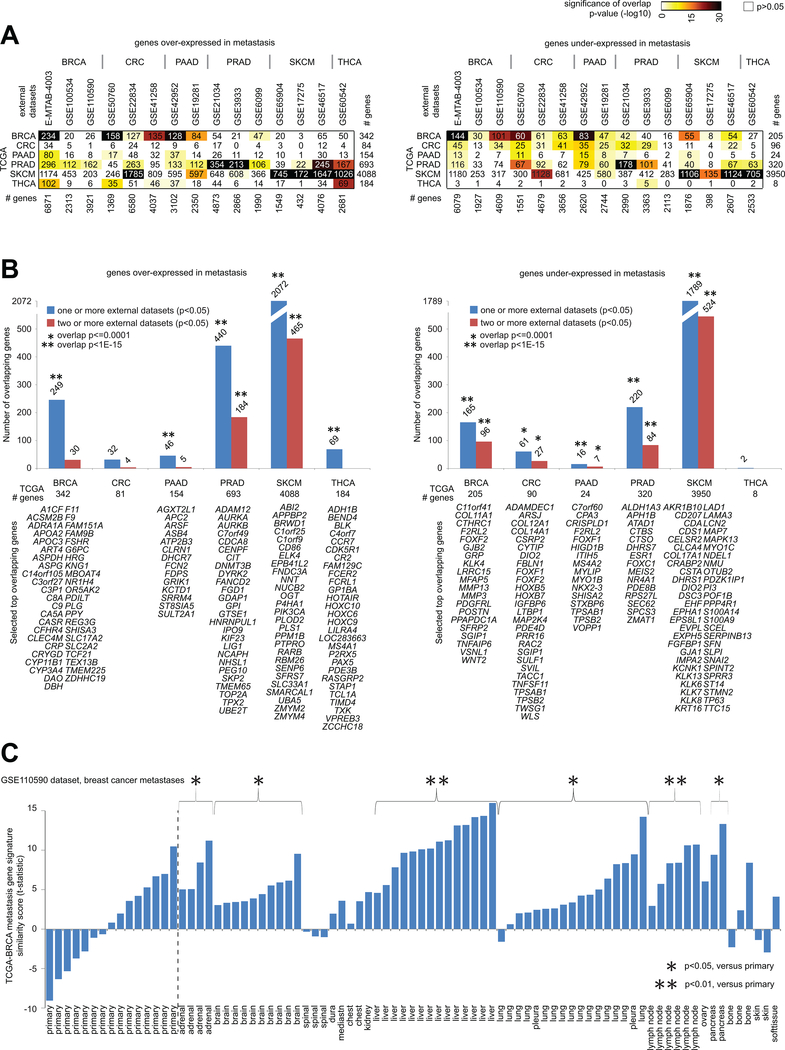
Figure 4. Significance of overlap between TCGA metastasis mRNA signatures and metastasis mRNA signatures from datasets external to TCGA.
(A) For both the genes over-expressed in metastasis for a given cancer type (left) and the genes under-expressed in metastasis for a given cancer type (right), the numbers of overlapping genes between the TCGA mRNA signatures (rows, signatures from Figure 1) and the genes over- or under-expressed in metastasis (p<0.05, t-test) in the indicated external datasets from previously published gene expression profiling studies (columns), along with the corresponding significances of overlap (using colorgram, by one-sided Fisher’s exact test, chi-squared test for TCGA SKCM gene sets). (B) For each indicated cancer type, numbers of genes overlapping between the TCGA metastasis signature genes (left, genes over-expressed in metastasis; right, genes under-expressed in metastasis) and the genes significantly high or low in metastasis (p<0.05, t-test) in the published external datasets corresponding to the given cancer type. Significance of overlap (by one-sided Fisher’s exact test; chi-squared test for SKCM genes) is indicated for TCGA genes found in one or more external datasets (blue bars) and in two or more external datasets (red bars). Selected top genes overlapping between TCGA and results from other datasets are listed (BRCA over-expressed: TCGA p<1E-6 and p<1E-6 for E-MTAB-4003 dataset; BRCA under-expressed: TCGA p<1E-6 and p<1E-6 for E-MTAB-4003 dataset; CRC under-expressed: TCGA FDR<10% and p<0.05 for two or more external datasets; PAAD over-expressed: TCGA FDR<10% and p<0.01 for GSE42952 dataset; PAAD under-expressed: TCGA FDR<10% and p<0.05 for one or more external datasets; PRAD over-expressed: TCGA FDR<10% and p<0.01 for all three external datasets; PRAD under-expressed: TCGA FDR<10% and p<0.05 for all three external datasets; SKCM over-expressed: TCGA FDR<10% and p<0.05 for all three external datasets; SKCM under-expressed: TCGA FDR<10% and p<0.05 for all three external datasets; THCA over-expressed: TCGA FDR<10% and p<0.001 for GSE60542 dataset; P-values by Pearson’s correlation or t-test on log-transformed data). (C) TCGA-BRCA metastasis gene expression signature similarity score (t-statistic as derived from the “t-score” metric(21, 45)), as applied to the sample profiles in the GSE110590 breast cancer metastases RNA-seq dataset(5). For selected groups of metastasis according to site, comparisons with the primary group are indicated (t-test as applied to the signature t-scores).

