
Figure 3.
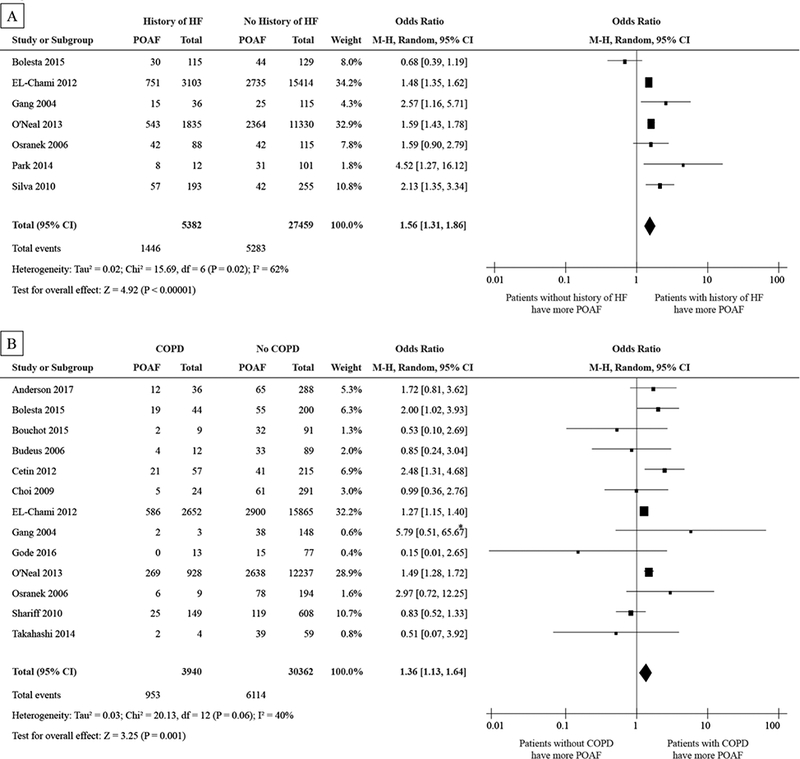
Forest plot showing the pooled POAF odds ratios for HF (A), COPD (B), hypertension (C), and MI (D).
Abbreviations as in Figure 2
*Large OR because of the small N for patients with COPD
Official websites use .gov
A
.gov website belongs to an official
government organization in the United States.
Secure .gov websites use HTTPS
A lock (
) or https:// means you've safely
connected to the .gov website. Share sensitive
information only on official, secure websites.
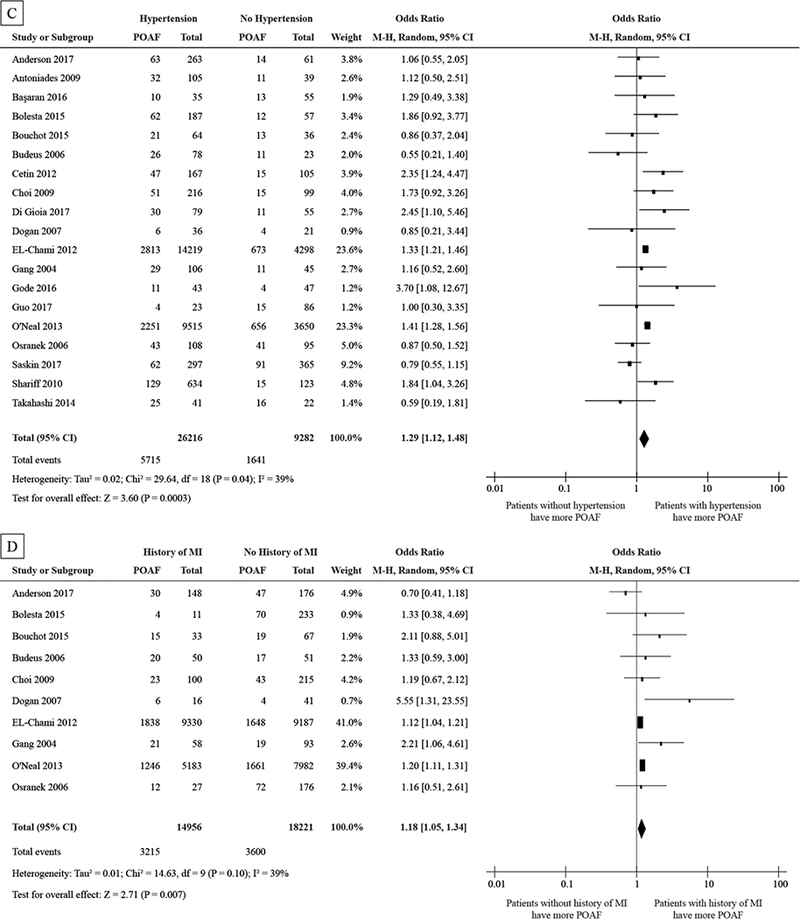
Forest plot showing the pooled POAF odds ratios for HF (A), COPD (B), hypertension (C), and MI (D).
Abbreviations as in Figure 2
*Large OR because of the small N for patients with COPD