
Figure 5:
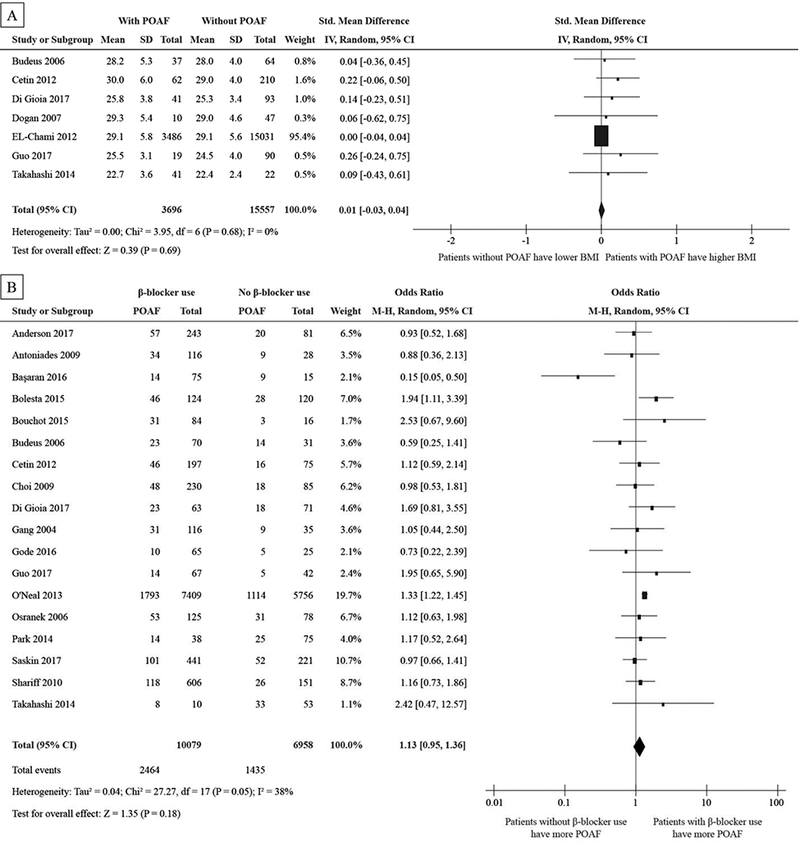
Forest plot showing std. mean difference of BMI (A) in kg/m2 and the pooled odds ratio for β-blocker use (B), gender (C), and dyslipidemia (D).
Abbreviations as in Figure 2
Official websites use .gov
A
.gov website belongs to an official
government organization in the United States.
Secure .gov websites use HTTPS
A lock (
) or https:// means you've safely
connected to the .gov website. Share sensitive
information only on official, secure websites.
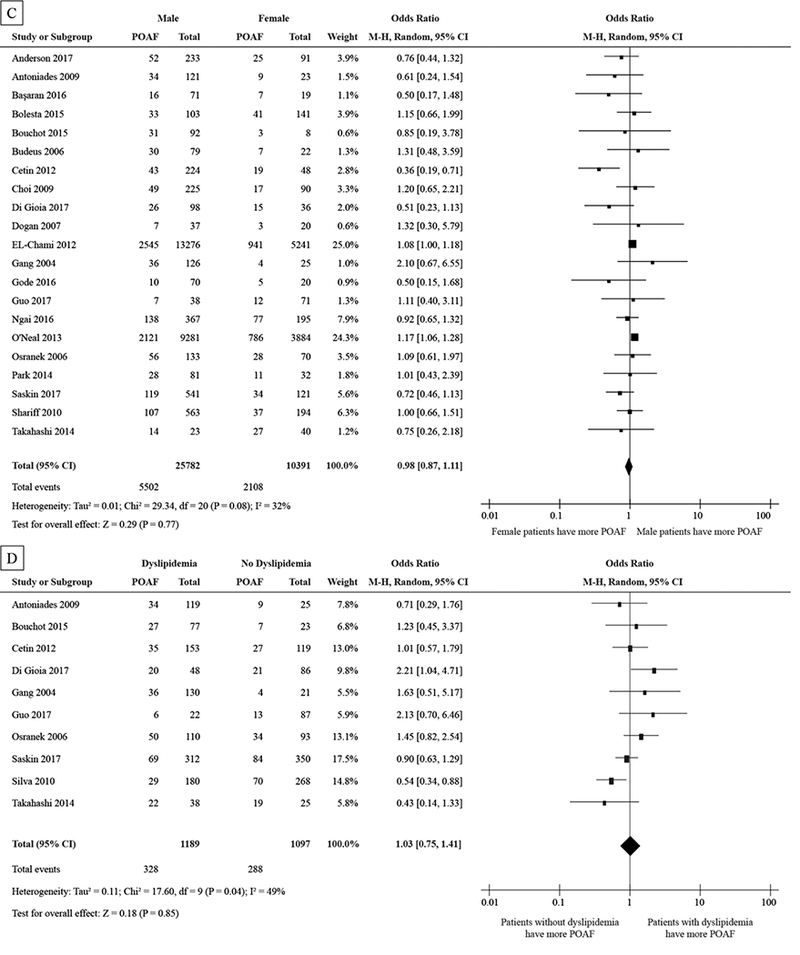
Forest plot showing std. mean difference of BMI (A) in kg/m2 and the pooled odds ratio for β-blocker use (B), gender (C), and dyslipidemia (D).
Abbreviations as in Figure 2