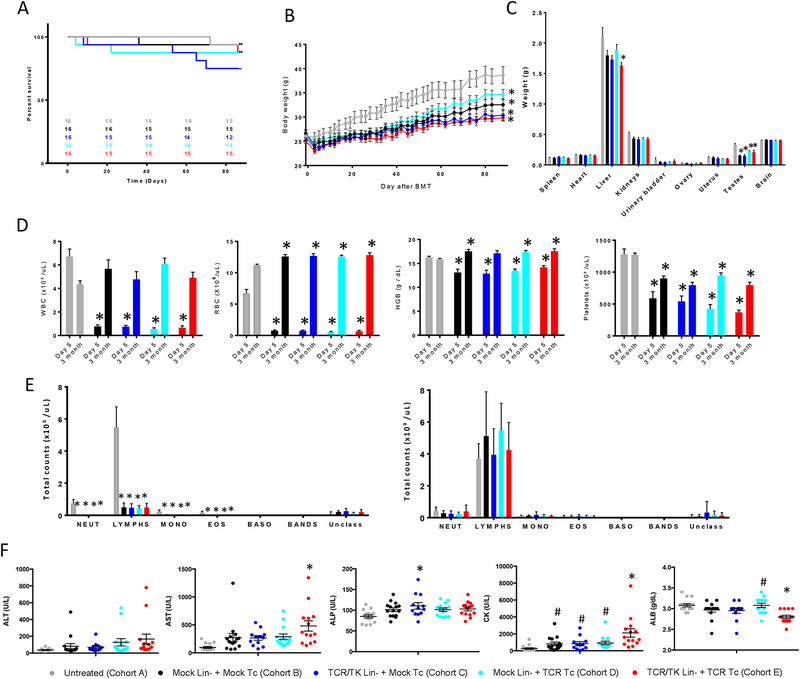
Figure 2. Co-administration of Lin- cells and T cells expressing NY-ESO-1 TCR does not have a negative impact on survival, body and organ weights, blood cell reconstitution and serum chemistry parameters three months after BMT.
TCR engineered Lin- cells and T cells were co-administered to myelodepleted 8- to 12-week-old HLA-A2/Kb mice by intravenous injection. Mice from each cohort were euthanized at day 5 (n=6) or 3 months (n=12–15) after BMT. A. Kaplan-Meier survival curve (Log-rank test p = 0.48). Numbers in the graph indicate survivor count at each time point. B. Total body weight. * p<0.05 vs untreated controls (cohort A), pair-wise comparisons of least-squares means in a linear model framework with Tukey-Kramer adjustment within each time point; considered significant only if 5 or more consecutive measurements were significantly different. C. Organ weights at 3 months after BMT. D. Hematology at day 5 and 3 months after BMT. WBC, White Blood Cells; RBC, Red Blood Cells; HGB, Hemoglobin. E. White Blood Cell differential count at day 5 (left) and 3 months (right) after BMT. Neut, neutrophils; Lymphs, lymphocytes; Mono, monocytes; Eos, eosinophils; Baso, basophils; Bands, Band cells; Unclass, Unclassified cells. F. Serum chemistry at 3 months after BMT. ALT, alanine aminotransferase; AST, aspartate aminotransferase; ALP, alkaline phosphatase, serum; CK, creatine kinase; ALB, Albumin. Mean ±SEM is plotted. * p<0.05 vs cohort A, # p<0.05 compared to cohort E (receiving transduced Lin- and transduced T cells), pair-wise comparisons of least-squares means in a linear model framework with Tukey-Kramer adjustment within each time point.

