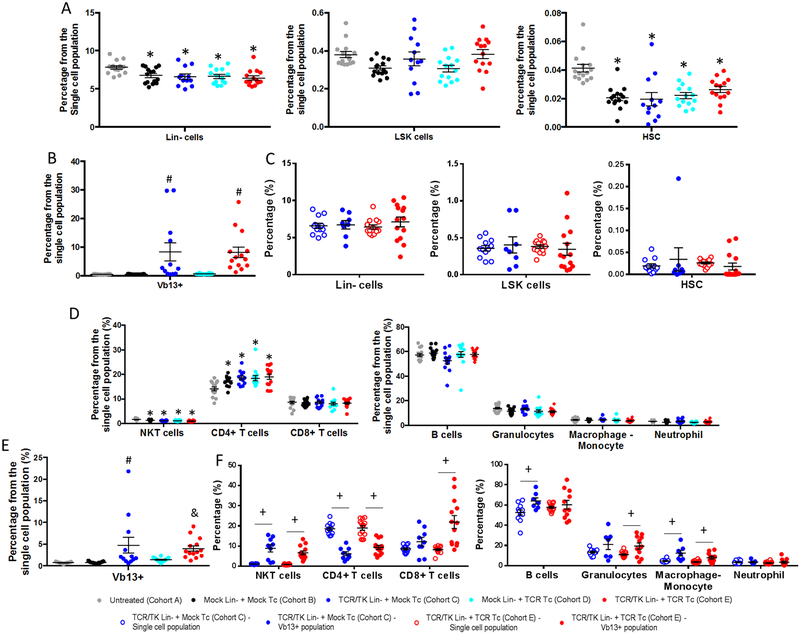
Figure 4. The expression of NY-ESO-1 TCR in Lin- cells and their co-administration with T cells expressing an NY-ESO-1 TCR does not have a negative impact on hematopoietic lineage differentiation.
Bone marrow cells and splenocyte phenotype characterization 3 months after BMT. TCR and cell surface markers were assessed by flow cytometry. A. Percentage of Lin- (left panel), LSK (Lin- ScaI+ cKit+, middle panel) and HSC (LSK CD150+ CD48-, right panel) cells in bone marrow. B. Percentage of NY-ESO-1 TCR-expressing cells in the bone marrow, detected by intracellular Vβ13 staining. C. Comparison of the frequency of Lin- (right), LSK (middle) and HSC (left) cells in the total bone marrow population (open circles) and the Vβ13+ population (closed circles). D. Percentages of NKT cells, CD4+ T cells, CD8+ T cells (left panel), B cells, granulocytes, macrophages and neutrophils (right panel) in the total splenocyte population, E. Percentage of NY-ESO-1 TCR-expressing cells in the splenocytes, detected by intracellular Vβ13 staining. F. Comparison of the frequency of NKT cells, CD4+T cells, CD8+ T cells (left panel), B cells, granulocytes, macrophages and neutrophils (right panel) in the total splenocyte population (open circles) and the Vβ13+ population (closed circles). Individual values and mean ±SEM are plotted (n=12–15). * p<0.05 vs cohort A; # p<0.05 vs Cohort A, B and D; & p<0.05 vs Cohort A and B; + p<0.05; pair-wise comparisons of least-squares means in a linear model framework with Tukey-Kramer adjustment.

