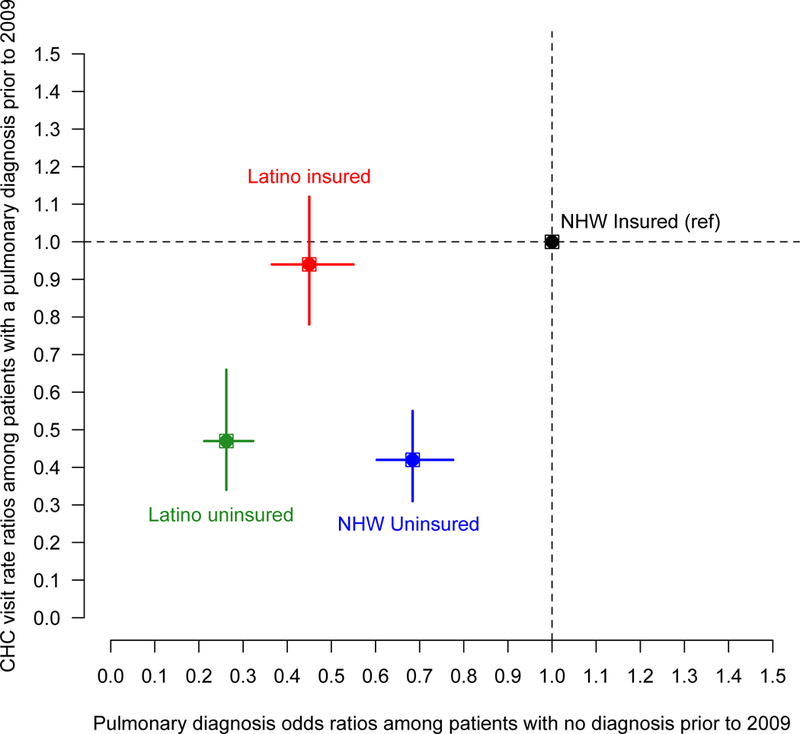
Figure 1.

Adjusted odds ratios of obstructive pulmonary disease during 2009–1013 among all study patients (x-axis) and community cealth center (CHC) visit rate ratios during 2009– 2013 among patients with a diagnosis prior to 2009 (y-axis) by race-ethnicity/insurance cohorts.Note for Figure 1: CHC, Community Health Center; NHW, Non-Hispanic White. Among n=34,849 study patients (x-axis), we utilized logistic regression to estimate the relative odds of pulmonary diagnosis during the study period (2009-2013) by cohort adjusted for sex, age, body mass index, pregnancy, and number of visits in the study period. Among patients diagnosed prior to 2009 (y-axis), we utilized Poisson regression to assess differences in CHC visit rates in 2009-2013, by cohorts, adjusting for covariates. Both models utilized robust standard errors to account for clustering within CHCs.
