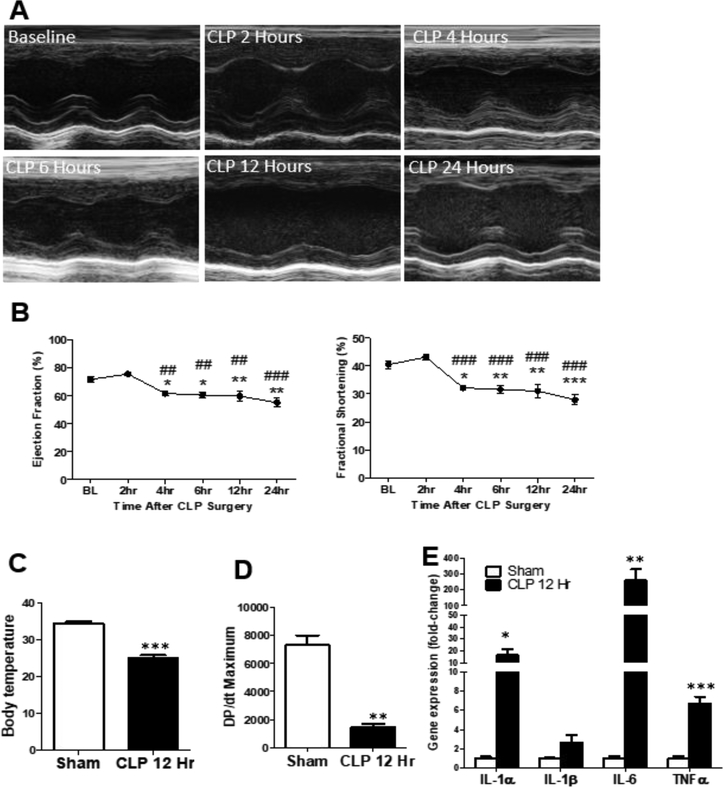
Figure 1: Establishment of septic cardiac dysfunction using the cecal ligation and puncture model (CLP) –
(A) Representative M-mode echocardiograms after CLP surgery. (B) Graph of ejection fraction (Ef) and fractional shortening (FS); n=5 mice, One-way ANOVA analysis *p:<0.05 vs baseline (BL), **p:<0.01 vs BL, ##p<0.01 vs 2h, ###p<0.001 vs 2 h by ANOVA with Bonferroni post-test. (C) Body temperature of mice 12 h after sham or CLP surgery. n=3–4 mice. (D) Graph of DP/dt maximum of mice 12 h post-sham and CLP surgery. n=3 mice. (E) Gene expression of inflammatory cytokines in ventricular tissue of mice 12hours post-sham and CLP surgery, n = 4–5 mice per group. *p < 0.05, **p < 0.01, ***p < 0.001 vs Sham by t-test.

