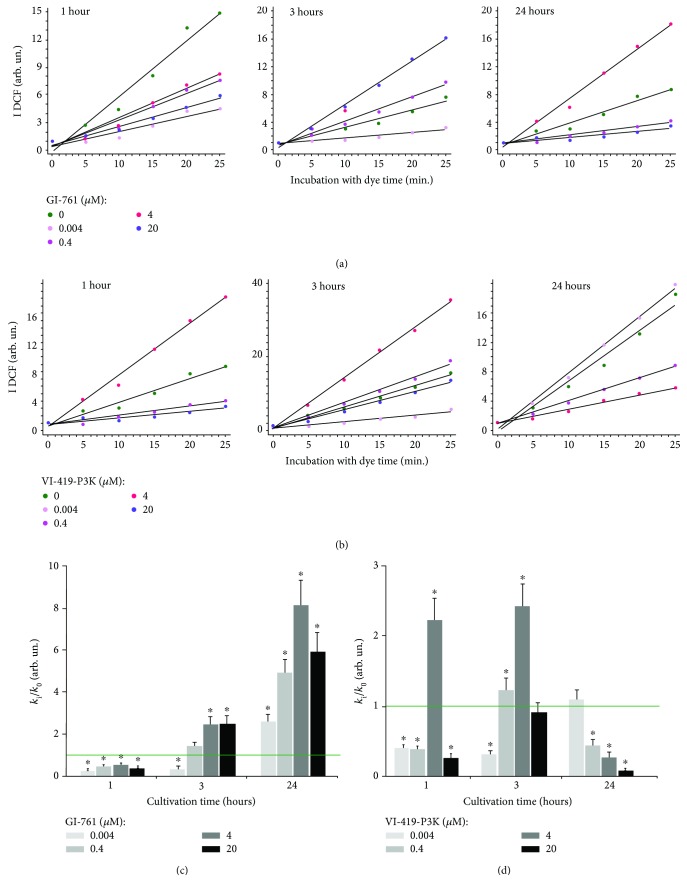
Figure 2.
ROS levels in cells treated with fullerene derivatives. (a, b) Fluorescence plate reader: dependence of DCF signal intensity on GI-761 (a) and VI-419-P3K (b) concentration and exposure time. (c, d) Dependence of the k i/k 0 index on GI-761 (c) and VI-419-P3K (d) concentration and exposure time.

