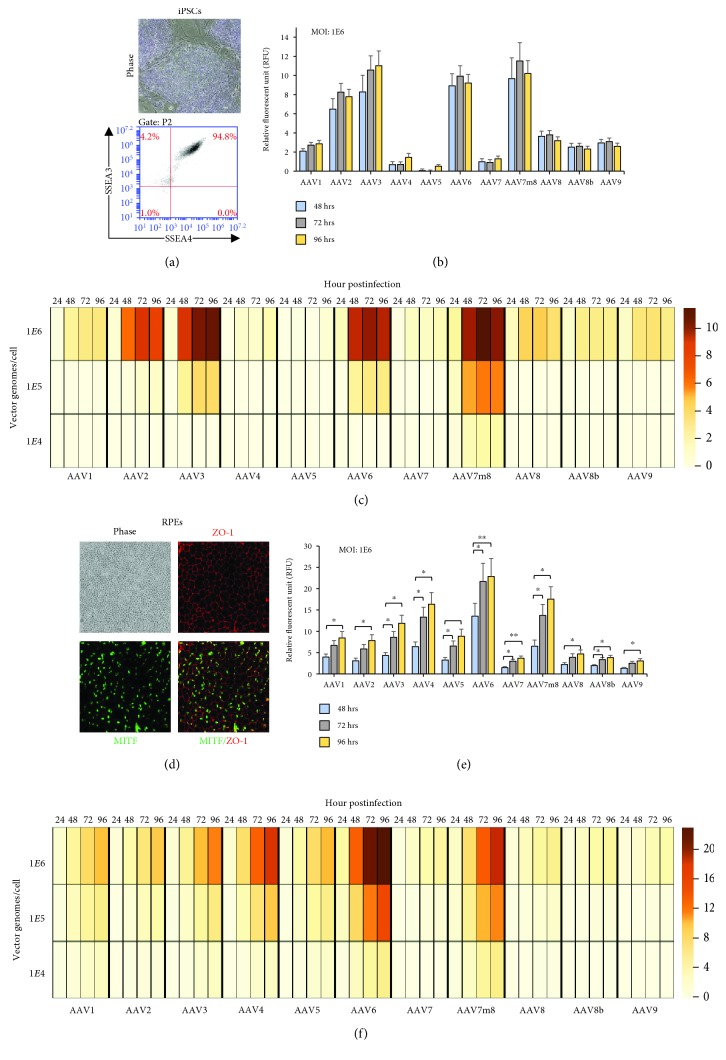
Figure 2.
iPSC and iPSC-RPE tropism of 11 rAAV serotypes. (a) Representative phase image showing morphology of IPSC cultures and flow cytometry analysis of pluripotency surface marker expression (SSEA3 and SSEA4) of iPS cells. (b) The onset of AAV-eGFP expression in iPSCs at a dosage of 1E6 vg/cell for all rAAV at 48, 72, and 96 h posttransduction. There is no significant difference between any two time points (48, 72, and 96 h) after correction for multiple comparisons using Tukey method. (c) Heat map showing relative AAV-GFP expression per cell across all rAAV, dosages, and time in iPSCs. The scale bar shows the intensity of AAV-eGFP expression presented as an arbitrary relative fluorescence unit (A.U.) per cell. (d) Retinal pigmented epithelium (RPE) showing “cobblestone” appearance in phase (10x magnification), and immunofluorescent labeling with expression of ZO-1 (red) and MITF (green), and merged images showing uniform RPE monolayer. Images were captured at 10x magnification. (e) AAV-eGFP expression in RPEs at a dosage of 1E6 vg/cell for all rAAV at 48, 72, and 96 h postinfection. Analysis of variance for repeated measures with post hoc pairwise comparisons between time points were performed with statistical significance indicated with pvalue < 0.05∗, <0.01∗∗, and <0.001∗∗∗ after correction for multiple comparisons using Tukey method. (f) Heat map showing relative AAV-eGFP expression per cell across all rAAV, dosages, and time in RPE cells.

