Figure 2.

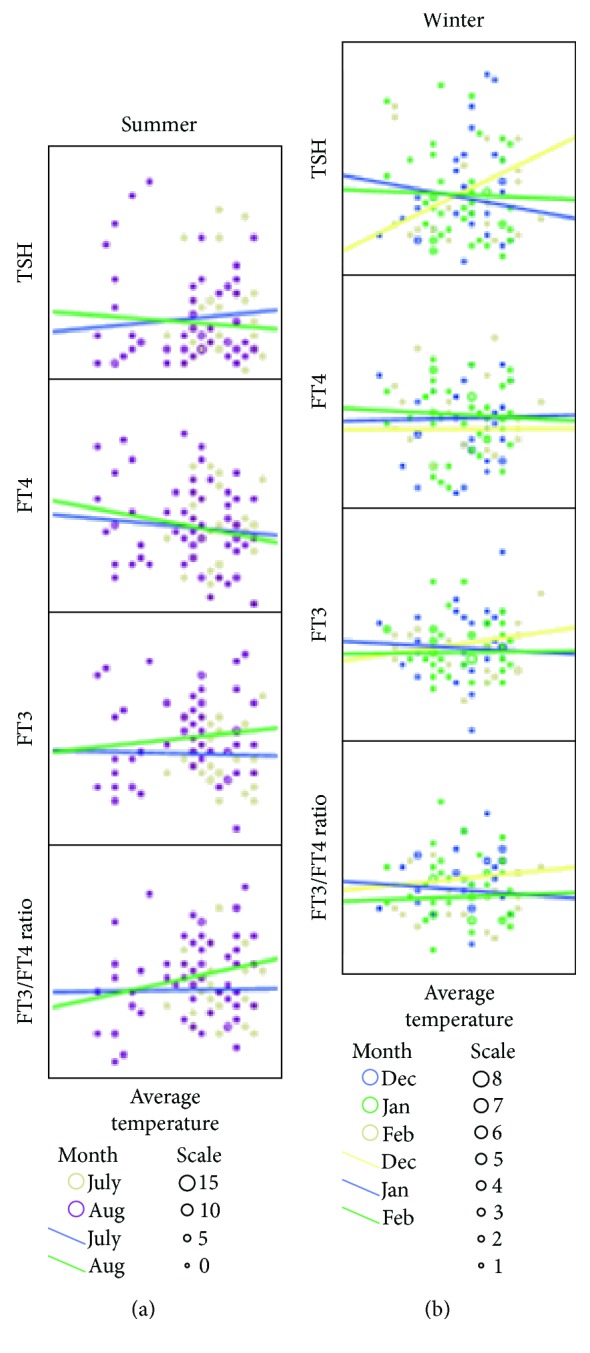
Changes of TSH, FT3, FT4, and FT3/FT4 ratio, according to the monthly temperature within the seasons. The scatter plots in both summer (a) and winter (b) are shown.

Changes of TSH, FT3, FT4, and FT3/FT4 ratio, according to the monthly temperature within the seasons. The scatter plots in both summer (a) and winter (b) are shown.