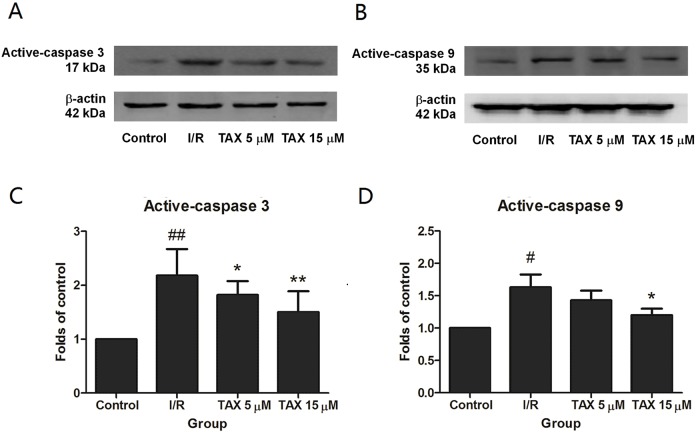
Figure 7. The changes in the levels of caspase 3, and caspase 9 at the end of reperfusion.
(A) Western blot image of caspase 3; (B) western blot image of caspase 9; (C) the relative expression of caspase 3 protein; (D) the relative expression of caspase 9 protein. #P < 0.05 and ##P < 0.01 compared with the control group, *P < 0.05 and **P < 0.01 compared with the I/R group.

