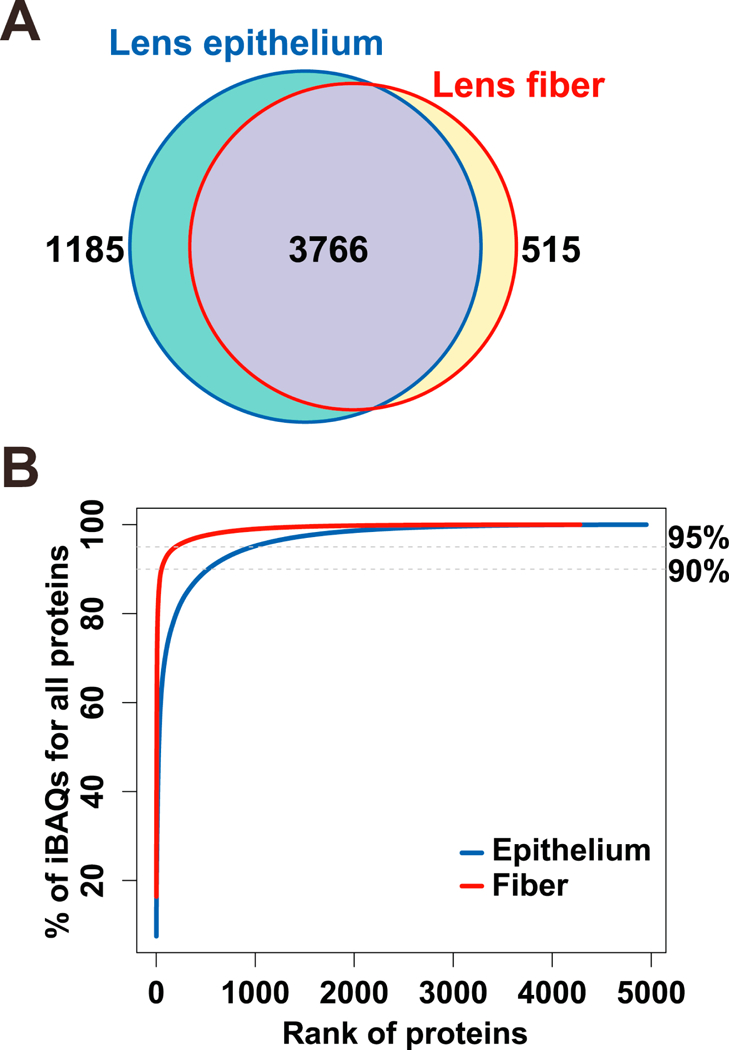
Fig. 1. Global analysis of P0.5 mouse lens epithelial and lens fiber proteomes.

(A) Venn diagram to compare proteomes of lens epithelium and lens fibers. (B) Saturation analysis as a function of relative abundance rank of individual proteins.

(A) Venn diagram to compare proteomes of lens epithelium and lens fibers. (B) Saturation analysis as a function of relative abundance rank of individual proteins.