
Fig. 1. Global analysis of P0.5 mouse lens epithelial and lens fiber proteomes.
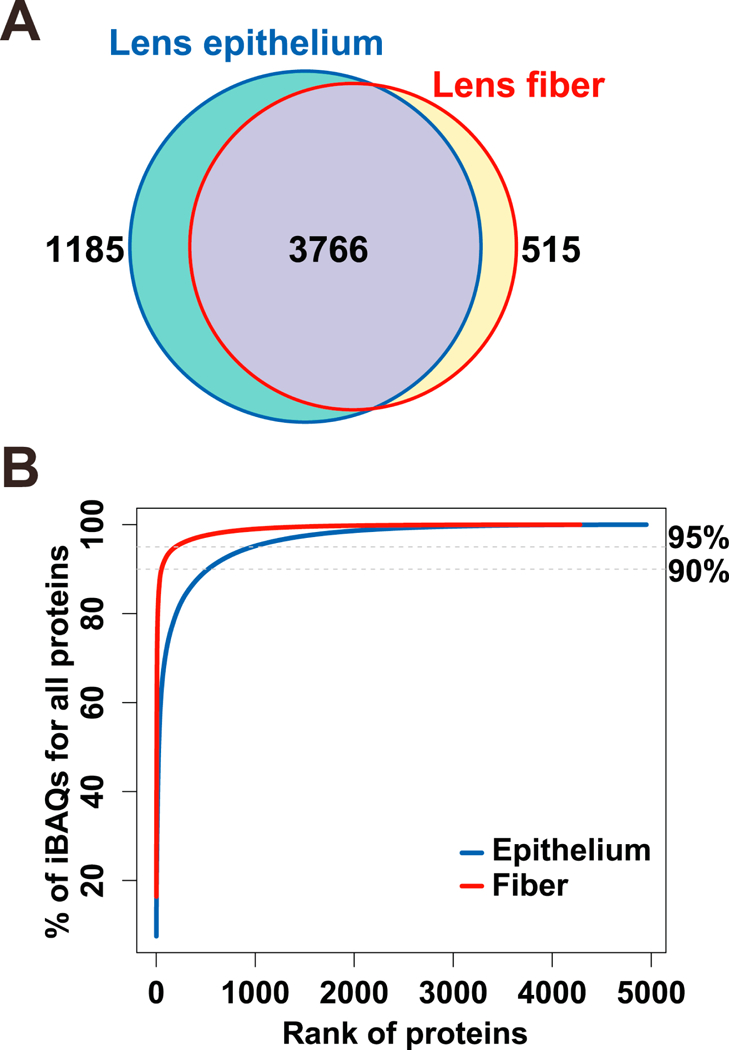
(A) Venn diagram to compare proteomes of lens epithelium and lens fibers. (B) Saturation analysis as a function of relative abundance rank of individual proteins.
Official websites use .gov
A
.gov website belongs to an official
government organization in the United States.
Secure .gov websites use HTTPS
A lock (
) or https:// means you've safely
connected to the .gov website. Share sensitive
information only on official, secure websites.
(A) Venn diagram to compare proteomes of lens epithelium and lens fibers. (B) Saturation analysis as a function of relative abundance rank of individual proteins.