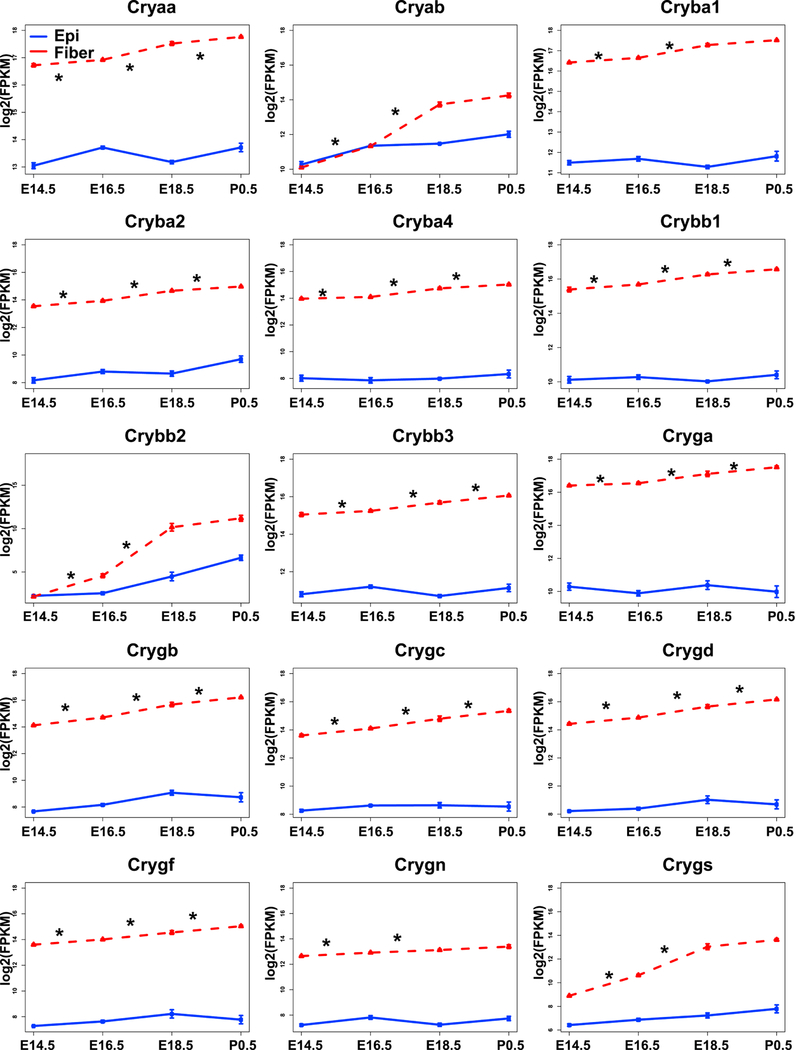
Fig. 4. Expression profiles of 15 individual crystallin genes by RNA-Seq.

The graphs illustrate that expressions of most crystallins in lens fibers (red) increased from E14.5 to P0.5. The expression in epithelium (blue) is also shown. The “*” indicates adjusted p value (by Benjamini-Hochberg method) <0.05.
