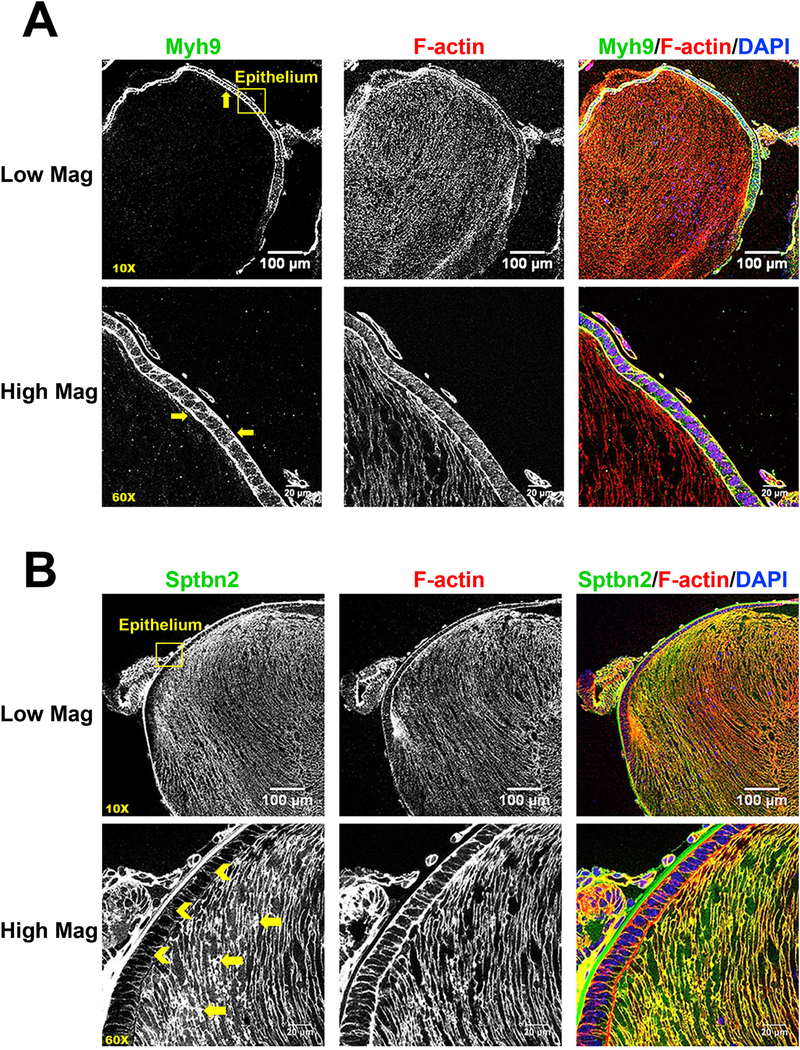
Fig. 8. Immunofluorescence analysis of expression of Myh9 and Sptb in mouse lens sections.

A) Immunostaining for Myh9 (green), F-actin (red) and DAPI (nuclei, blue) in P0.5 CD1 mouse lens sections. Low magnification (10X) images show that Myh9 is expressed mostly in lens epithelial cells (see yellow arrows). High magnification (60X) images demonstrate the Myh9 is highly concentrated at the apical-apical interface between lens epithelial and fiber cells (see yellow arrows). B) Immunostaining for β2-spectrin (green), F-actin (red) and DAPI (blue) in mouse lens sections reveals that β2-spectrin is highly expressed in lens fiber cells (see yellow arrows) with low signal in lens epithelial cells (see yellow chevrons). Yellow boxes were used to indicate the positions of high magnification images. Scale bars: 100 µm (low magnification, top panels) and 20 µm (high mag, lower panels).
