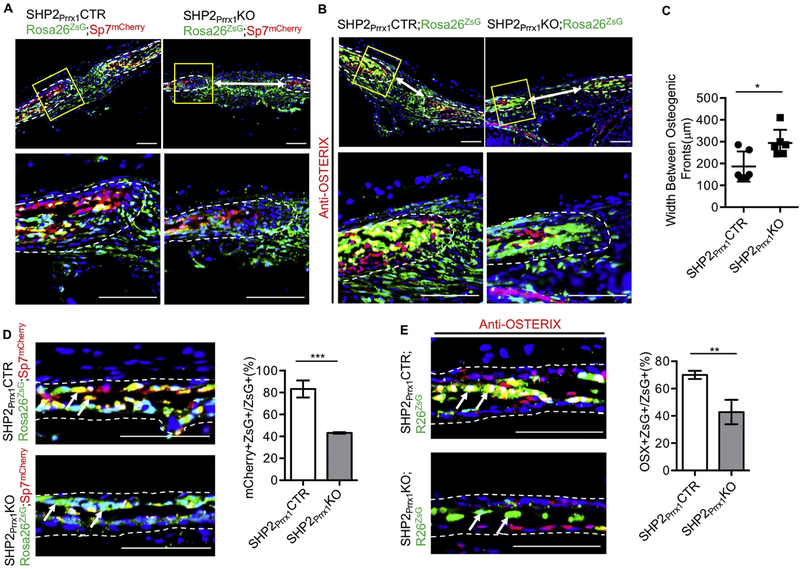
Figure 2. SHP2 is required for the osteogenic differentiation of the Prrx1+ mesenchymal cells.
A. Fluorescent images of the sagittal sutures showing the number and location of Prrx1+ (green), Osx+ (red), and Prrx1/Osx double positive cells (yellow) at the osteogenic fronts and sutures. Note that the number of Prrx1 and Osx double positive cells decreased and the width of the sagittal suture (white arrows increased significantly in SHP2Prrx1KO;Rosa26ZsG;Sp7mCherry mice, compared with the SHP2Prrx1CTR;Rosa26ZsG;Sp7mCherry controls. Images at the bottom are the enlarged views of the corresponding boxed areas in the top images. Scale bar: 100μm. B. Sagittal sutures of indicated mice immunostained with anti-OSTERIX antibody (red) showing the number and location of Prrx1+ (green), OSTERIX+ (red), and Prrx1/OSTERIX double positive cells (yellow) at the osteogenic fronts and sutures. Images at the bottom are the enlarged views of the corresponding boxed areas in the top images. Scale bar: 100μm. Scale bar: 100μm. C. Bar graphs showing the quantitative data of sagittal suture width (images of A and B) in the P0.5 SHP2Prrx1CTR and the SHP2Prrx1KO mice (n=6, *P<0.05, Student’s t-test). D-E. Fluorescent images of the parietal bone frozen sections showing the number and location of Prrx1+ (green), Osx+ (red), OSTERIX+ (red), and Prrx1 and Osx (OSTERIX) double positive (yellow) cells in the indicated mice. Quantitative data are shown as bar graphs on the right (n=3, ***p<0.001, Student’s t-test) Scale bar: 100μm.

