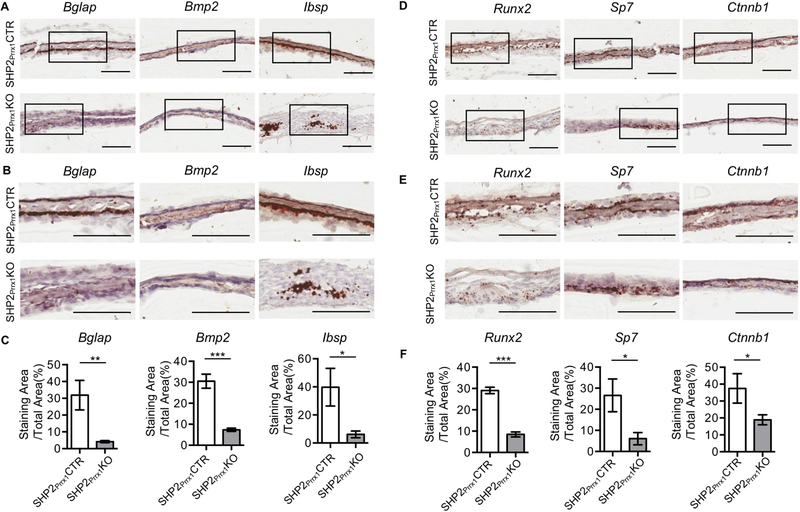
Figure 3. SHP2 deletion in the Prrx1-expressing mesenchymal cells impairs osteogenic marker genes and osteogenic transcription factors expression during intramembranous ossification.
A. RNAscope-based in situ hybridization shows the transcript abundance of indicated osteogenic genes in the P0.5 parietal bone of SHP2Prrx1CTR and SHP2Prrx1KO mice. Scale bar: 100μm. B. Enlarged views of the corresponding boxed areas in A. Scale bar: 100μm. C. Bar graphs show the quantitative data of A & B. Data presented as the ratio of the positive staining areas vs. the corresponding total areas using NIH ImageJ (n=3, *p<0.05, **p<0.01, ***p<0.001, Student’s t-test). D. The transcript abundance of indicated osteogenic transcription factors in the P0.5 parietal bone of SHP2Prrx1CTR and SHP2Prrx1KO mice were presented as described in A. Scale bar: 100μm. E. Enlarged views of the corresponding boxed areas in D. Scale bar: 100μm. F. Bar graphs show the quantitative data of D & E. Data presented as the ratio of the positive staining areas vs. the corresponding total areas using NIH ImageJ (n=3, *p<0.05, **p<0.01, ***p<0.001, Student’s t-test).

