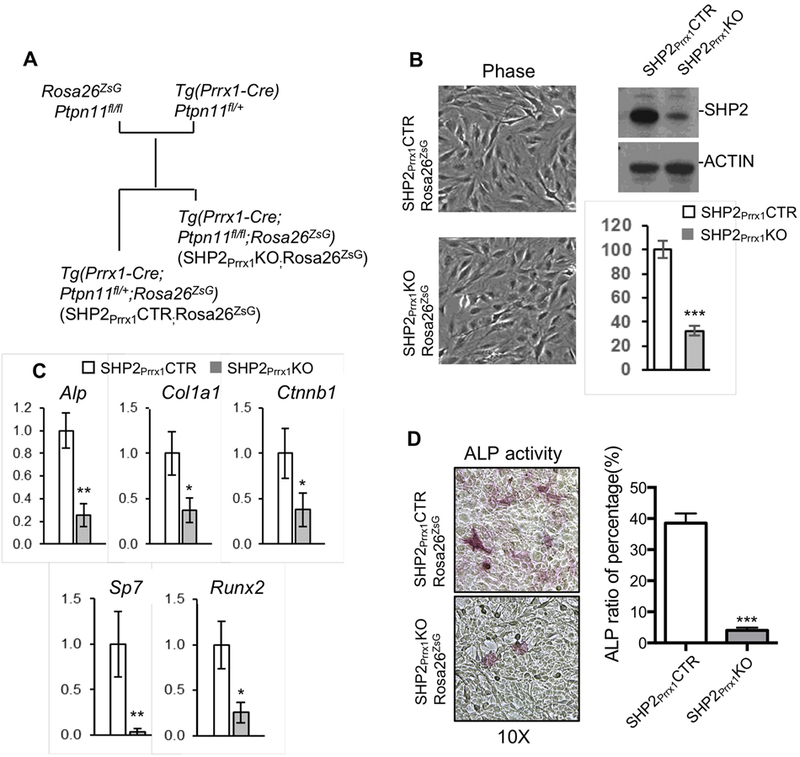
Figure 4. SHP2 deletion in the Prrx1-expressing cells compromises osteogenic genes expression in vitro.

A. Diagram denotes the strategy to generate SV40 large T antigen-immortalized osteoblasts from the SHP2Prrx1CTR;Rosa26ZsG and SHP2Prrx1KO;Rosa26ZsG mice. B. Phase contrast images (left) showing the morphology of immortalized osteoblasts. Western blot and bar graphs [44] demonstrating the level of SHP2 in the immortalized osteoblasts from indicated mice (n=3, ***P<0.001, Student’s t-test). C. Bar graphs showing the relative expression of indicated osteogenic genes in SHP2Prrx1CTR and SHP2Prrx1KO osteoblasts determined by qRT-PCR. (n=3, *p<0.05,**p<0.01, Student’s t-test). D. Phase contrast images demonstrating ALP activity in the immortalized osteoblastic cells from indicated mice. Ratio of ALP positive cells vs total cells in the defined areas are presented as bar graphs on the right (n=3, ***p<0.001, Student’s t-test).
