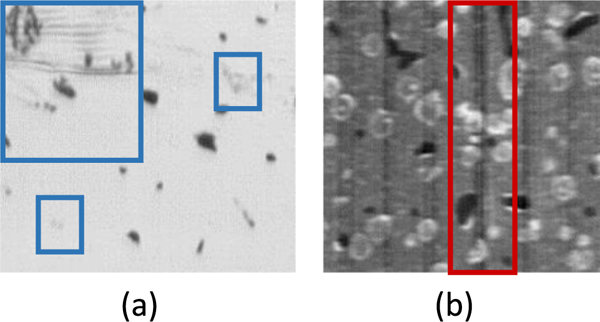
Fig. 1.

A cropped section of two different KESM data sets using different stains: India-Ink (a) and Thionin (b) collected using KESM. Poor staining can lead to a loss of fibers (blue), while striping can lead to over002dsegmentation (red), our algorithm was tested on both of these data sets.
