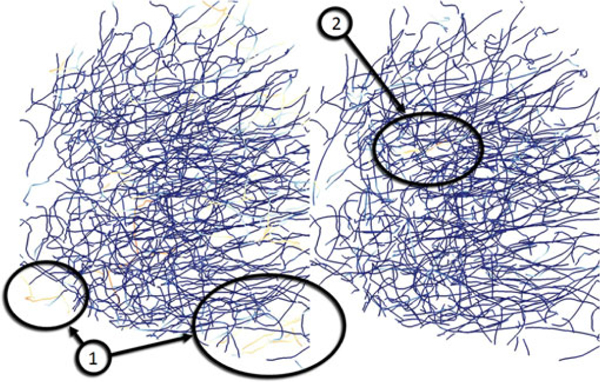
Fig. 10.

A comparison of the manually traced network (left) and the predictor-corrector algorithm (right) using a single initial seedpoint. All brightly colored fibers on the left represent fibers present in the manual segmentation but absent in the predictor-corrector results contributing to the false-negative ratio (FNR), while bright fibers on the right are present in the automated segmentation but absent in the manual segmentation increasing the false positive ratio (FPR). Majority of the fibers found during manual segmentation are also present in the automatically segmented network. The major contributors to the FNR are the fibers on the edge of the network that are not connected to the central network.
