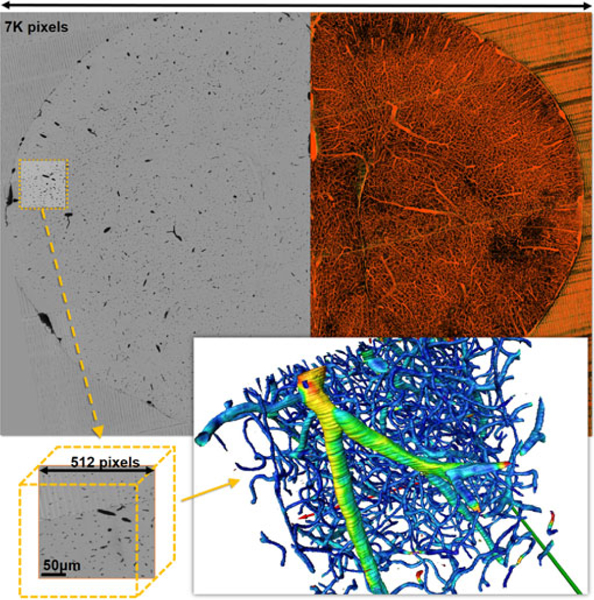
Fig. 3.

KESM image of a mouse brain (top left) shown as a maximum intensity projection over 1,000 slices (top right). The total depth of the image stack is 7,000 slices. Traditional approaches rely on extracting a sub-volume (bottom left) to generate an iso-surface for visualization (bottom right). Here, color mapping is based on vessel radius. As the volume size increases, the visualization quickly becomes GB to interpret.
