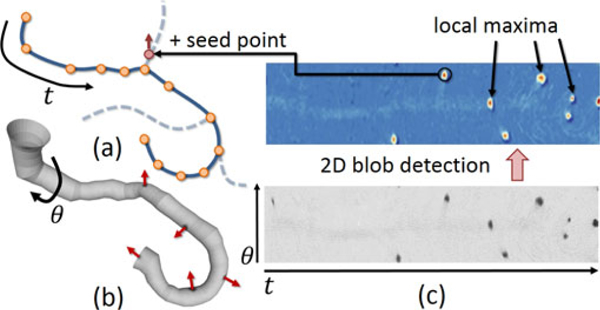
Fig. 5.

The vessel centerline (a) is used to define a 2D manifold R that takes the form of a generalized cylinder (b). This cylinder is unwrapped into a flat image (c, bottom). Candidate seeds are found using LoG blob detection (c, top). These candidate seed points in are mapped back into Cartesian coordinates in Г. Their initial orientation v0 is given by the associated normal to R (red arrows). These serve as the starting state for candidate fibers.
