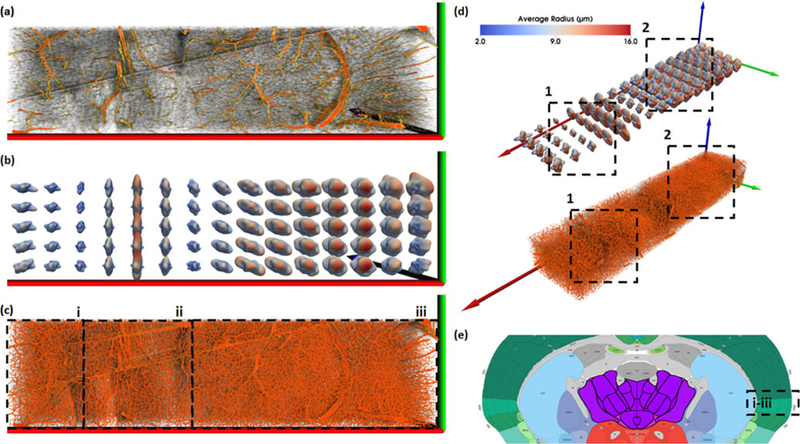
Fig. 8.

Visualization of a large section of segmented tissue (e) using spherical harmonic (SH) glyphs from several perspectives. The visualized data covers multiple brain regions, including CP (i), ccb/scwm (ii), and the cortical surface (iii). We present resampled data showing large vessels (a) and the actual data (c) visualized using MIP. Glyphs (b and d) use two colormaps. (b) When the color map corresponds to the shape of the spherical function, the highlighted directions indicate the direction of longer vessels. (d) Alternatively, basing the colormap on vessel radius indicates the prominent directions of blood flow. In this case, the glyph shape and colormap indicate two different features: the glyph shape indicates vessel volume/direction, while the glyph color indicates vessel radius/direction. The size of the glyphs correlates with the density of the microvasculature in the region, as seen by the difference is density between regions (1) and (2). At the cost of complexity and size, SH glyphs are better than superquadrics at showing anisotropy and connectivity. The ccb/scwm (ii) is surrounded by smaller glyphs on the left and right, signifying a small amount of microvasculature connecting the structure to CP (i) and the cortical surface (iii), which is biologically true. Furthermore, the shape of the SH glyphs highlight the anisotropic characteristics of the microvascular network, such as in the cortical surface (2) where the vessels are more homogeneous in growth when compared the structure in region (1), where the vessels tend toward the y/z-plane, further supporting that the ccb/scwm structure is microvascularly separable from it’s neighbors in this area.
