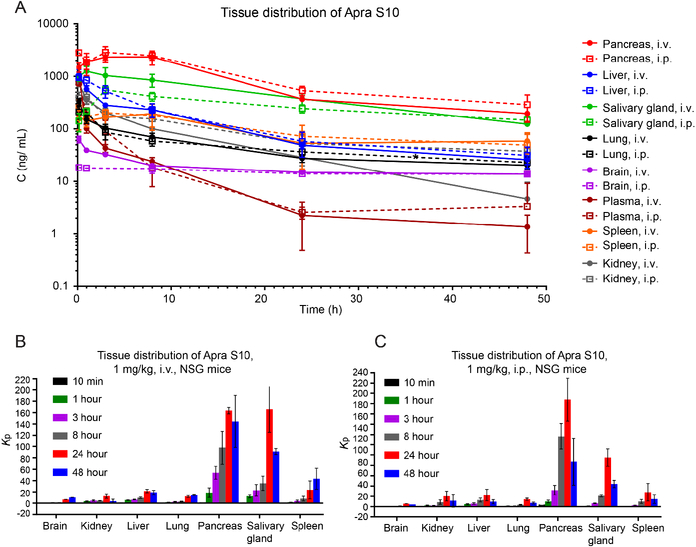
Fig. 3.
Concentrations of Apra S10 in plasma and tissues following a single i.v. or i.p. administration of 1 mg/kg Apra S10 to mice (a). Solid lines indicate i.v. tissue distribution profiles. Dashed lines indicate i.p. profiles. Numbers represent the average of three mice in each group, with error bars indicating SD. Tissue distribution histogram of i.v. (b) and i.p. (c) administration. Kp: tissue:plasma partition coefficients. Numbers represent the average of three mice in each group, with error bars indicating SD.

