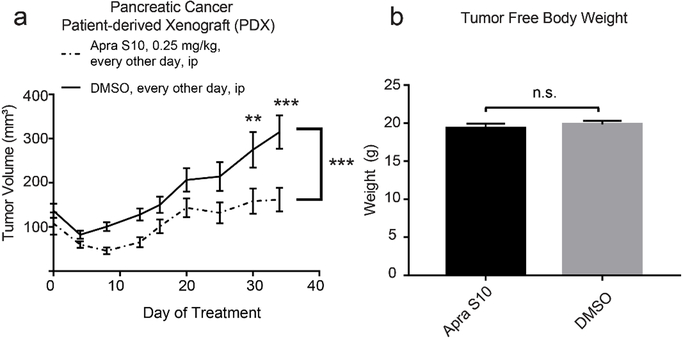
Fig. 5.
(a) Tumor volume over the course of treatment, plotted as mean with standard error. P-values were calculated using a repeated measures two-way ANOVA and Sidak’s multiple comparisons test for each individual time points. (b) tumor free body weight upon euthanasia of mice. P-values were calculated using a student’s t-test and plotted as mean with standard error. *P < 0.05, **P < 0.01, ***P < 0.001.

