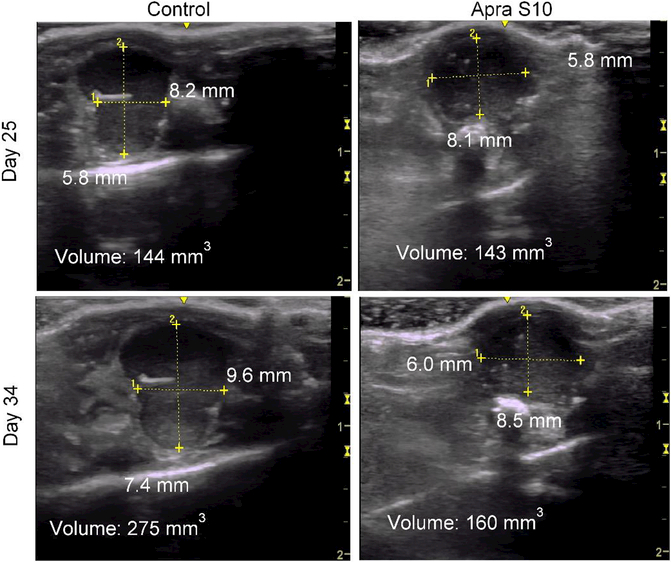
Fig. 6.
Ultrasound images of a representative control DMSO treated mouse on the left with area and volume at Day 25 (top left) and Day 34 (bottom left) as shown. Representative ultrasound images of an Apra S10 treated mouse on the right with area and volume at Day 25 (top right) and Day 34 (bottom right) as shown. Scale in centimeters on right side of each ultrasound image.

