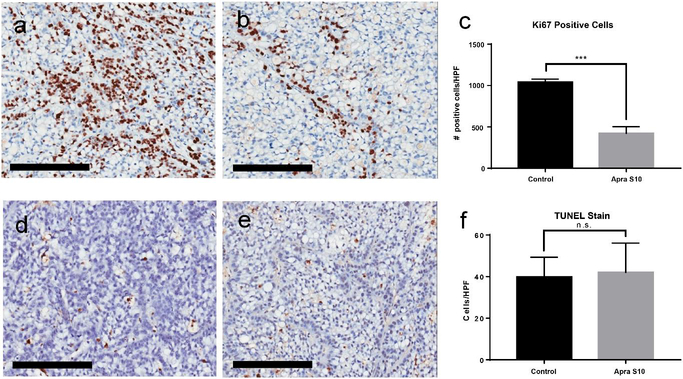
Fig. 7.
Representative images of tumors stained for Ki-67 brown of (a) control mouse and (b) Apra S10 treated mouse. (d) The average number of positive cells per HPF calculated using ImageJ. Representative images of tumors with TUNEL staining brown of (d) control mouse and (e) Apra S10 treated mouse. (f) The average number of positive cells per HPF by manual calculation. Scale bars represent 200 μm. Error bars represent SD. HPF High powered field; *** P-value < 0.001

