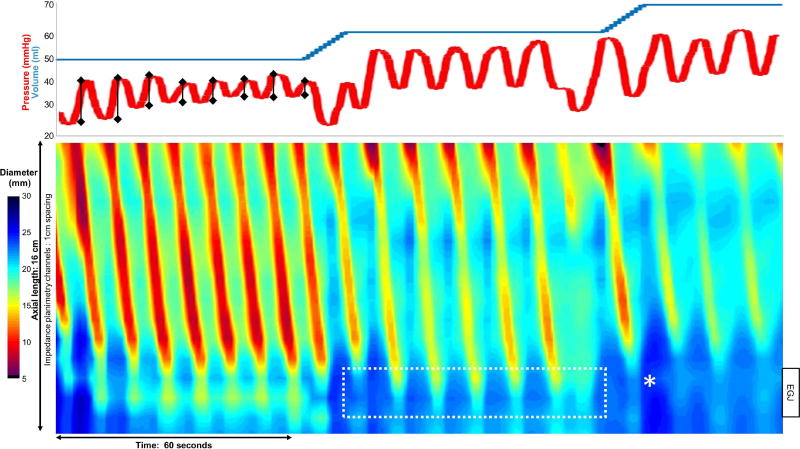
Figure 1. FLIP panometry.
A portion of a FLIP study is displayed with diameter (color-coded) by time FLIP topography plot (bottom) and corresponding intra-balloon pressure (top; red) and distension volume (top, blue). The EGJ-distensibility index (DI) was calculated during the 60-ml fill volume within the EGJ region (dashed white box) and measured 6.7 mm2/mmHg. In this subject, the maximum EGJ diameter (white *) occurred during a contraction at the 70-ml fill volume. The contraction-associated pressure amplitude (vertical black lines) were assessed during the 50ml fill volume. Figure used with permission from the Esophageal Center at Northwestern.

