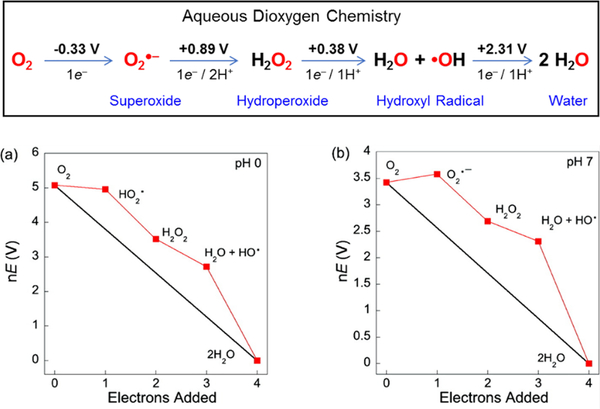
Figure 1.
(Top) Stepwise reduction of dioxygen. Reduction potentials are given in volts vs NHE at 25 °C, 1 bar, pH = 7. (Bottom) Frost diagrams depicting the free energy (nE) of the ROS intermediates during stepwise O2 reduction to water at (a) pH = 0 and (b) pH = 7. Adapted from ref 1. Copyright 2010 American Chemical Society.

