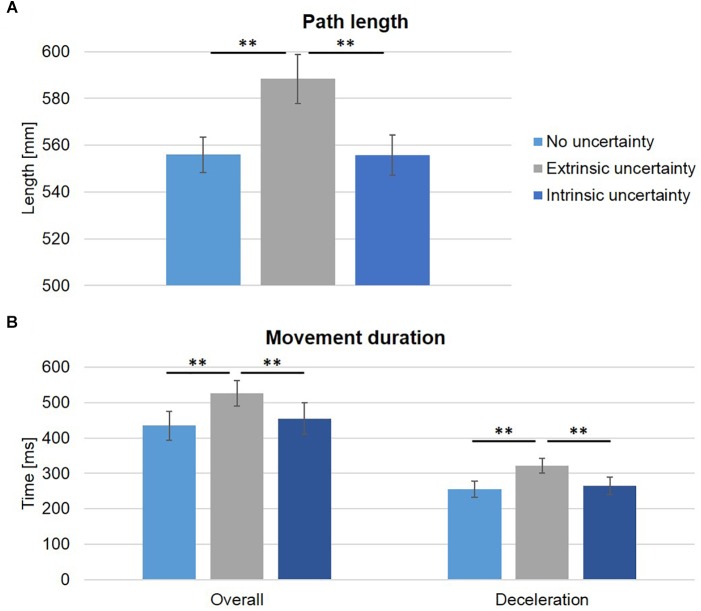
FIGURE 5.
Spatial and temporal movement characteristics. (A) The group averages (±SE) of path length (horizontal and vertical direction, in mm) are displayed for the three experimental conditions. Path length was significantly increased under extrinsic uncertainty as compared to the other two conditions. (B) Average overall movement duration and duration of deceleration are displayed. Again, the mean ± SE are plotted. Overall movement duration was significantly increased under extrinsic uncertainty, which was related to the significantly increased deceleration duration in this condition. Note that although the proportion of time spent after peak velocity was not statistically different between experimental conditions; ∗∗p < 0.01.

