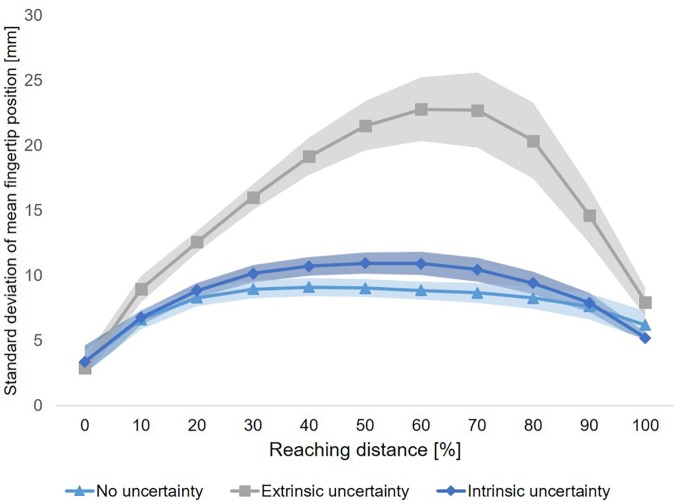
FIGURE 6.
Time course of variability of fingertip position. For each of the three experimental conditions, the time course of movement variability (mean ± SE) is displayed. Each of the three time courses show an increase-decrease pattern of movement variability, which is most strongly pronounced for Condition B (“extrinsic uncertainty”). There is no difference in variability of fingertip position at movement start between the three experimental conditions.

