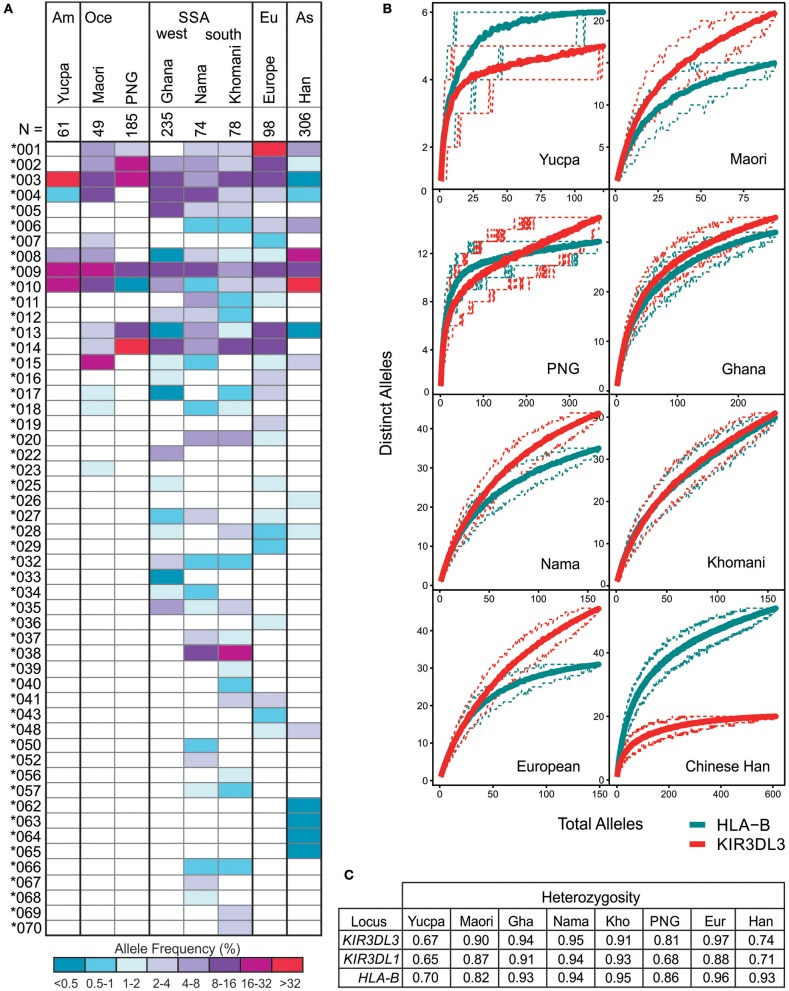
Figure 4.
KIR3DL3 shows extensive heterozygosity. (A) Shown is the distribution of KIR3DL3 allotype frequencies from eight human populations analyzed to high resolution. Shades of dark blue to dark red represent the allele frequencies. As given in the key; dark red/purple indicates a higher frequency, dark blue indicates low frequency. Am, South America; Oce, Oceania; SSA, sub-Saharan Africa; Eu, Europe; As, Asia; N, number of individuals. Bold lines group geographically similar populations. (B) Shown are rarefaction plots, which compare the distribution of distinct KIR3DL3 (red) alleles with that of distinct HLA-B (blue) alleles in each population. For each gene, the mean number of distinct alleles observed is plotted relative to the number of individuals sampled (solid lines). The 0.05th and 0.95th quantile counts for each gene are also shown (dotted lines). The counts shown are based on 200 independent permutations of resampling. The upper limit of the x-axis is determined by the number of individuals in the population that were genotyped. (C) Heterozygosity values for KIR and HLA alleles in the eight populations.

