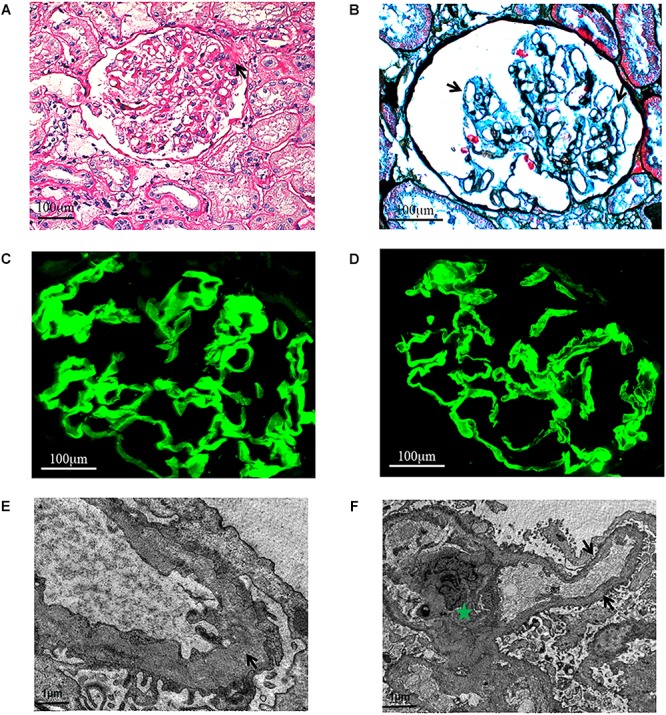
FIGURE 2.

Light microscopy. (A) Focal segmental glomeruosclerosis (x400, PAS.). One segmental sclerosis with top adhesion (black arrow). (B) Diffuse vacuolar degeneration (black arrows) of the GBM (x600, PASM+Masson.). Immunofluorescence. The α3 and α5 chains are distributed in the GBM (x600). (C) α3 chain. (D) α5 chain. Electron microscopy. (E) The thickness of GBM is different and the density is uneven (black arrow). Green Pentagram shows mesangium and mesangial cells. (F) The mesangial insertion can be seen in a few of segments, and the dense layer of GBM is tearing and stratified (black arrow).
