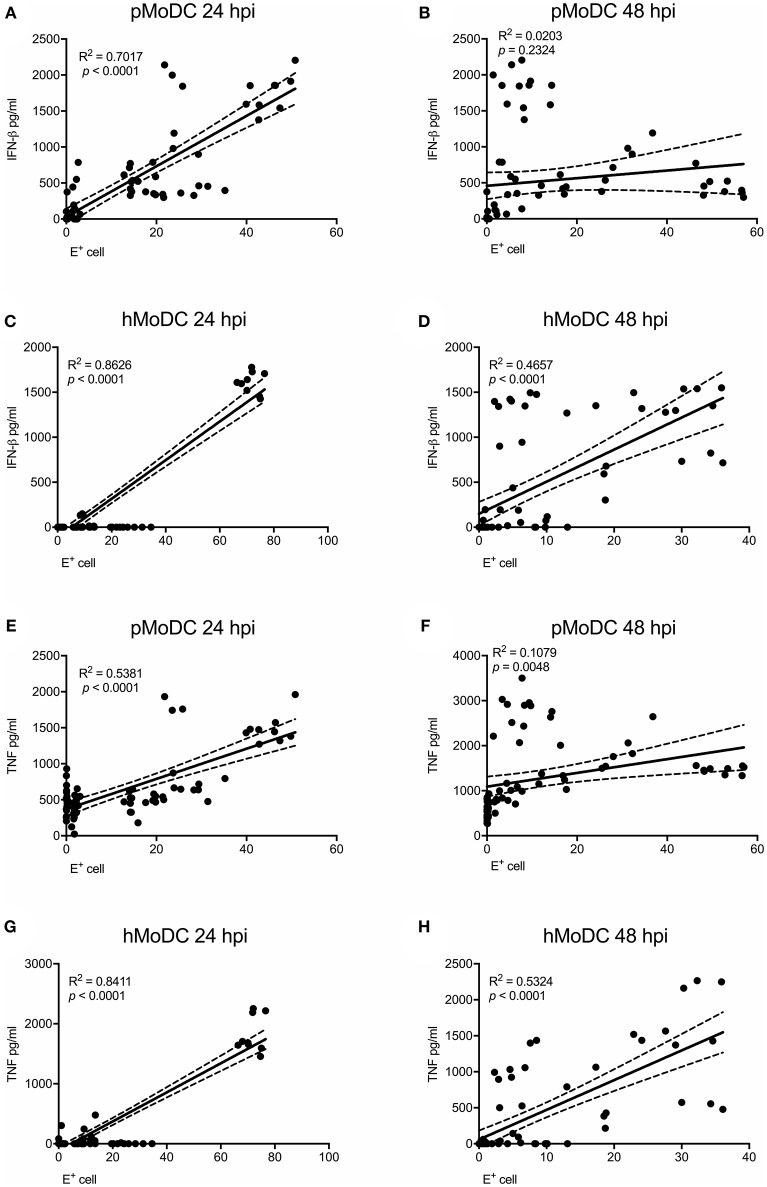
Figure 5.
Correlation analysis between E protein positive cells and pro-inflammatory cytokines. Correlations between E protein positive cells and IFN-β (A–D) or TNF (E–H) for pMoDC at 24 and 48 hpi (A,E and B,F; respectively) and for hMoDC at 24 and 48 hpi (C,G and D,H; respectively) were calculated by Spearman's Rho analysis. Correlations are shown as linear regression, R2 and p values are indicated for each analysis.

