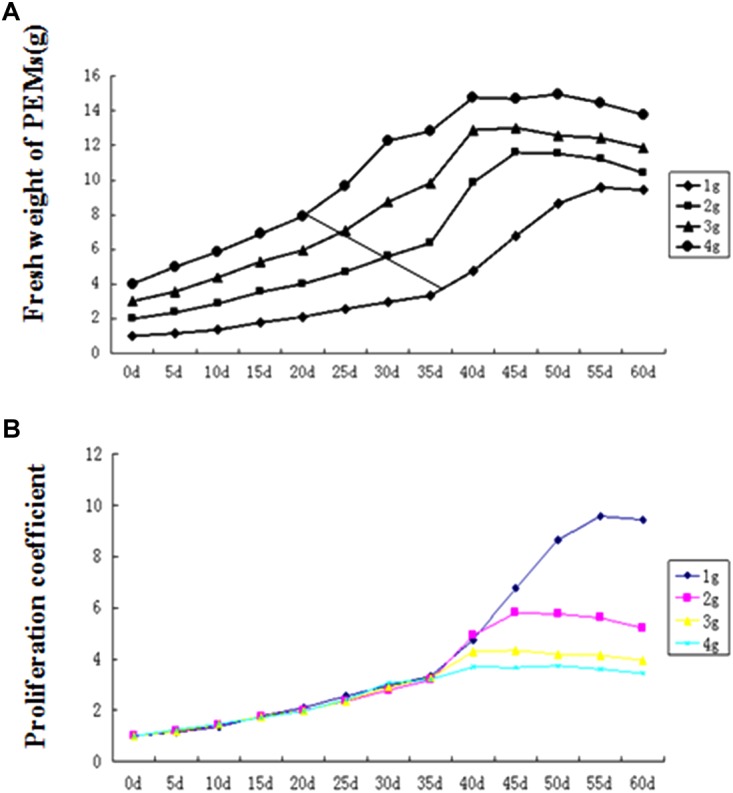
FIGURE 2.

Proembryogenic mass (PEM) proliferation curves for different amounts of inoculum. (A) Proliferation rate curves (showing total fresh weight over time) for different inoculum amounts. (B) Proliferation coefficient curves (showing fresh weight of culture/fresh weight of inoculum) for different inoculum amounts. The diagonal line in (A) indicates the inflection point (between slow growth and logarithmic growth) in each curve.
