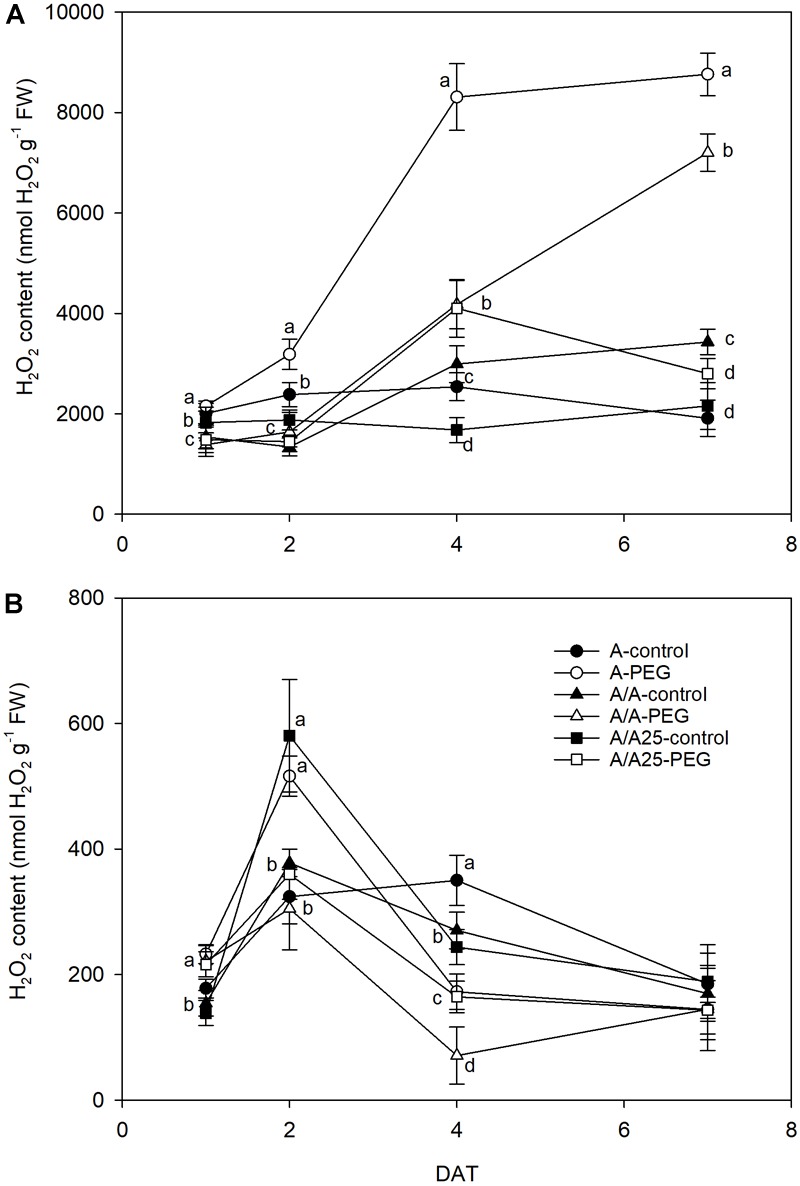
FIGURE 9.

Hydrogen peroxide concentration in the leaves (A) and roots (B) of the non-grafted pepper plants (cultivar Adige, A), self-grated plants (A/A), and plants grafted onto A25 (A/A25) under the control conditions (0% PEG) and 5% PEG on 1 DAT, 2 DAT, 4 DAT, and 7 DAT (days after treatment with PEG began). Data are the mean values for n = 4 ± SE. For each studied time, different letters indicate significant differences at P < 0.05 (LSD test). In (B), the absence of letters on 7 DAT means no significant difference for both factors (plant and treatment).
