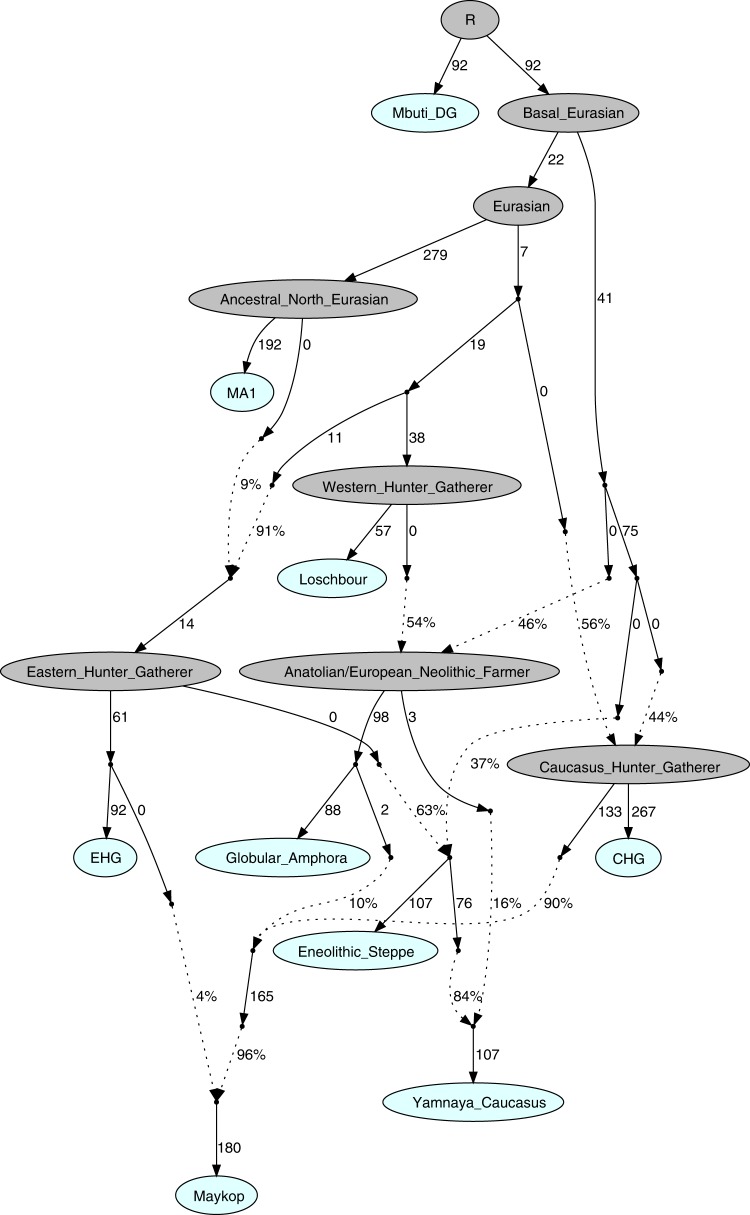
Fig. 5.
Admixture Graph modelling of the population history of the Caucasus region. We started with a skeleton tree without admixture, including Mbuti, Loschbour and MA1. We grafted onto this EHG, CHG, Globular_Amphora, Eneolithic_steppe, Maykop, and Yamnaya_Caucasus, adding them consecutively to all possible edges in the tree and retaining only graph solutions that provided no differences of |Z| > 3 between fitted and estimated statistics. The lowest Z-score for this graph is |Z| = 2.824. We note that the maximum discrepancy is f4(MA1, Maykop; EHG, Eneolithic_steppe) = −3.369 if we do not add the 4% EHG ancestry to Maykop. Drifts along edges are multiplied by 1000 and dashed lines represent admixture

