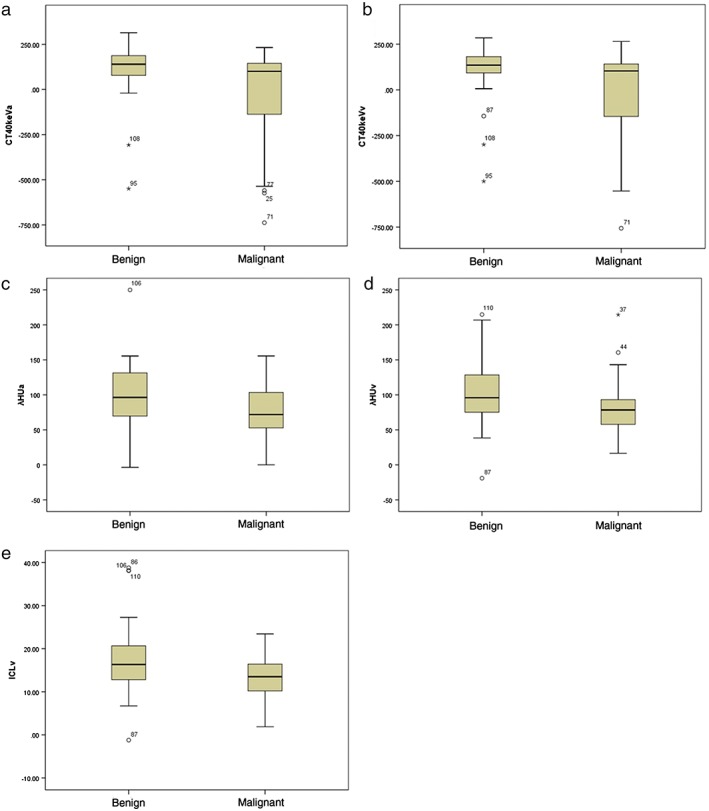
Figure 2.

The graphs show box‐whisker plots for comparisons between benign and malignant solitary pulmonary nodules (SPNs): (a) monochromatic computed tomography (CT) number enhancement on 40 and keV images in CT40keVa and (b) CT40keVv, and Hounsfield unit (HU) curves (c) λHUa and (d) λHUv in the arterial (a) and venous (v) phases, respectively; and (e) the iodine concentration in the v phase (ICLv). Box‐whisker plots are shown, in which the lower box boundary indicates the 25th percentile, the line within the box marks the median, and the top box boundary indicates the 75th percentile. Error bars below and above the boxes indicate the 10th and 90th percentiles, respectively. Other data are represented as individual dots. The CT40keVa, CT40keVv, λHUa, λHUv and ICLv of malignant SPNs were significantly lower than those of benign SPNs (all P < 0.05).
