Figure 4.

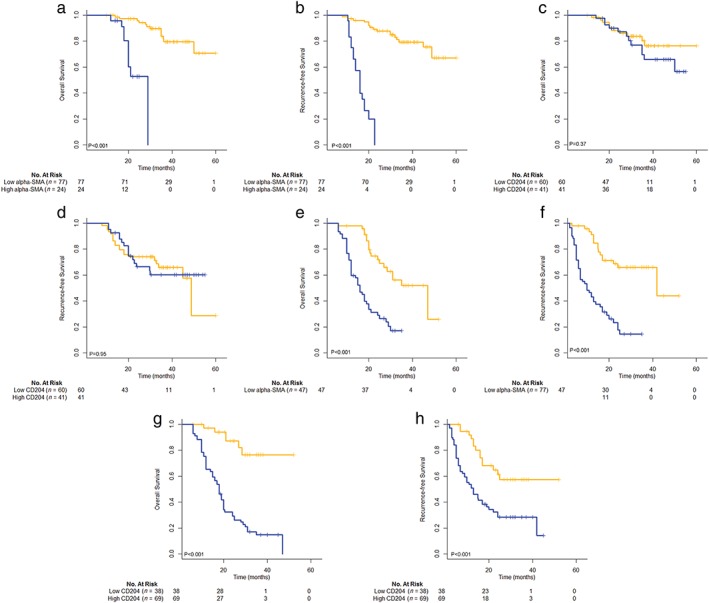
Subgroup analysis of the prognostic role of α‐smooth muscle actin (SMA) and CD204 based on spread through air space (STAS) status. Overall and recurrence‐free survival curves of STAS‐negative patients according to (a,b) the scoring of α‐SMA‐positive cancer‐associated fibroblasts (CAFs) (both P < 0.001) and (c,d) the number of CD204‐positive tumor‐associated macrophages (TAMs) (P = 0.37 and P = 0.95, respectively); and STAS‐positive patients according to (e,f) the scoring of α‐SMA‐positive CAFs (both P < 0.001) and (g,h) the number of CD204‐positive TAMs (both P < 0.001). ( ) Low alpha‐SMA (n = 77) (
 ) high alpha‐SMA (n = 24), (
 ) low alpha‐SMA (n = 77) (
 ) high alpha‐SMA (n = 24), (
 ) low CD204 (n = 60) (
 ) high CD204 (n = 41), (
 ) low CD204 (n = 60) (
 ) high CD204 (n = 41), (
 ) low alpha‐SMA (n = 47) (
 ) high (
 ) alpha‐SMA (n = 60), (
 ) low alpha‐SMA (n = 77) (
 ) high alpha‐SMA (n = 24), (
 ) low CD204 (n = 38) (
 ) high CD204 (n = 69), and low CD204 (n = 38) (
 ) high CD204 (n = 69).
