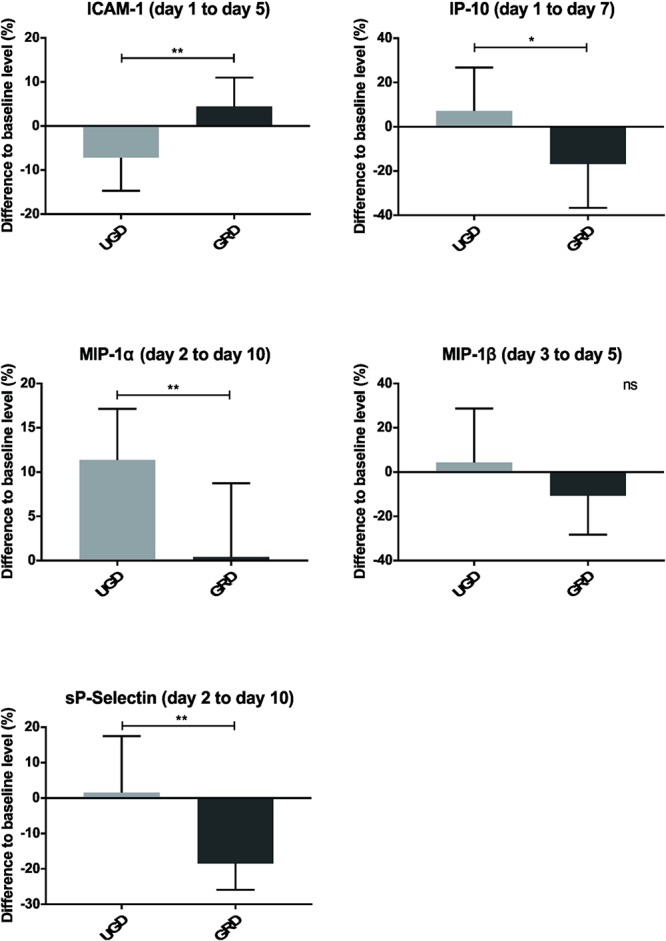
Figure 6.

Inflammation markers observed over a defined time, including sICAM-1, IP-10, MIP-1α, MIP-1β, and sP-selectin; represented as mean with standard deviation of the defined days of each group; nsP > 0.05, ∗P ≤ 0.05, ∗∗P ≤ 0.01, ∗∗∗P ≤ 0.001.

Inflammation markers observed over a defined time, including sICAM-1, IP-10, MIP-1α, MIP-1β, and sP-selectin; represented as mean with standard deviation of the defined days of each group; nsP > 0.05, ∗P ≤ 0.05, ∗∗P ≤ 0.01, ∗∗∗P ≤ 0.001.